This topic contains a solution. Click here to go to the answer
|
|
|

Did you know?
Methicillin-resistant Staphylococcus aureus or MRSA was discovered in 1961 in the United Kingdom. It if often referred to as a superbug. MRSA infections cause more deaths in the United States every year than AIDS.

 Cheiracanthium punctorium, displaying fangs
 Red-Green Color Blindness Is a Sex-Linked Trait in Humans
 Red-Green Color Blindness Is a Sex-Linked Trait in Humans
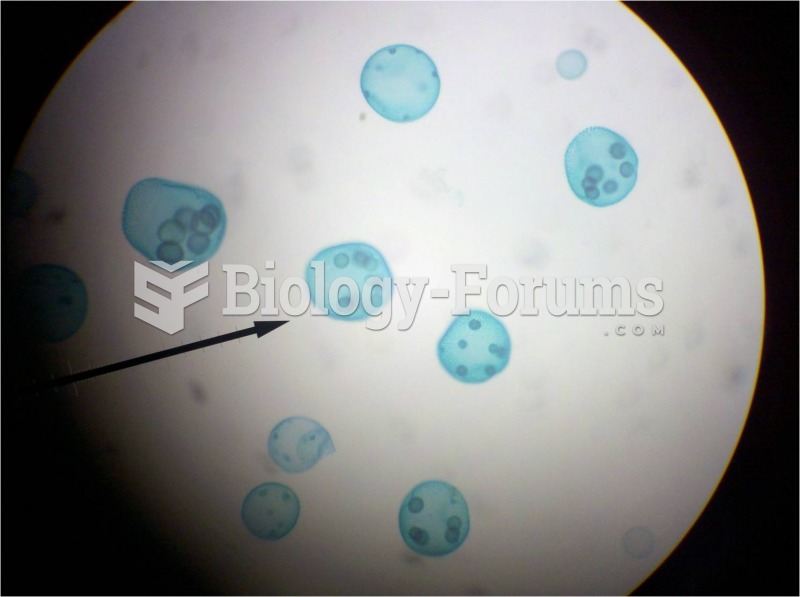 volvox green algae (protist)
 Electrophoresis gel in a densitometer. (a) The green light from the slit light source is visible ...
 The yellow, blue, and green sections of the Emergency Response Guidebook (ERG). The yellow section ...