This topic contains a solution. Click here to go to the answer
|
|
|

 The transition from college to first job can be a triggering situation for new growth in meaning ...
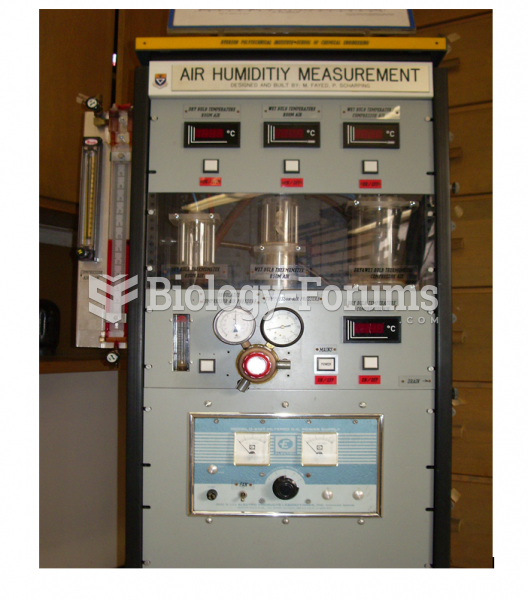 Humidity Measurement and Gas Flowrate Experiment
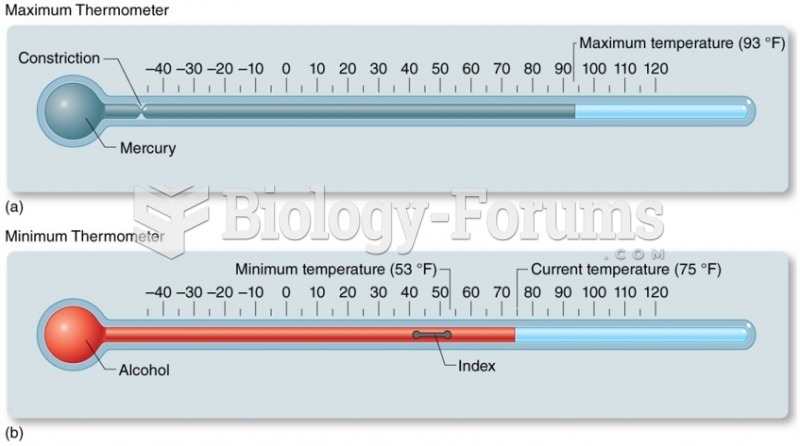 Measurement of Temperature
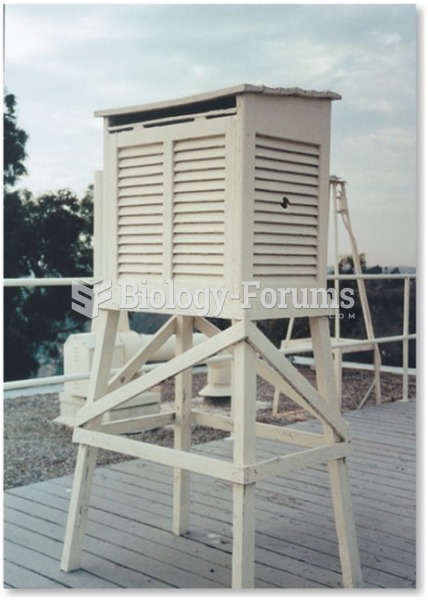 Measurement of Temperature: Instrument Shelters
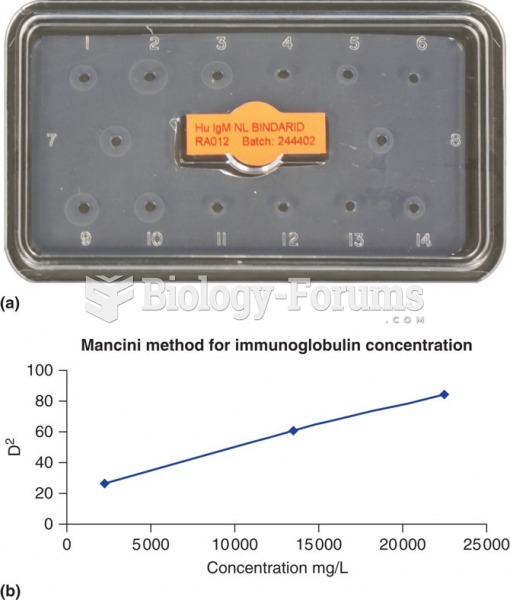 (a) A photograph of a radial immunodiffusion reaction for measurement of patient IgA concentrations. ...
 Waist Measurement