This topic contains a solution. Click here to go to the answer
|
|
|

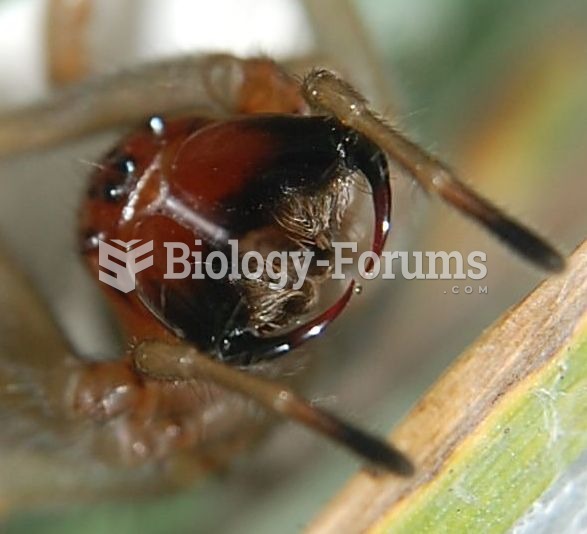 Cheiracanthium punctorium, displaying fangs
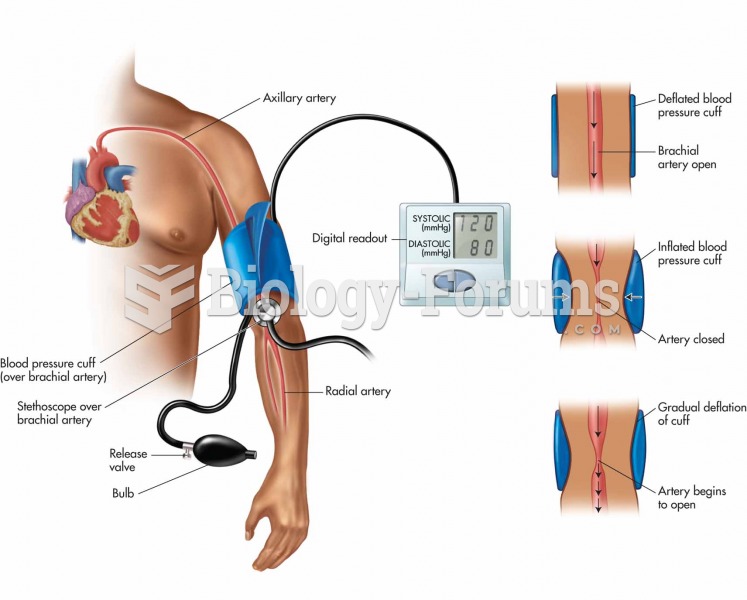 Blood pressure measurement.
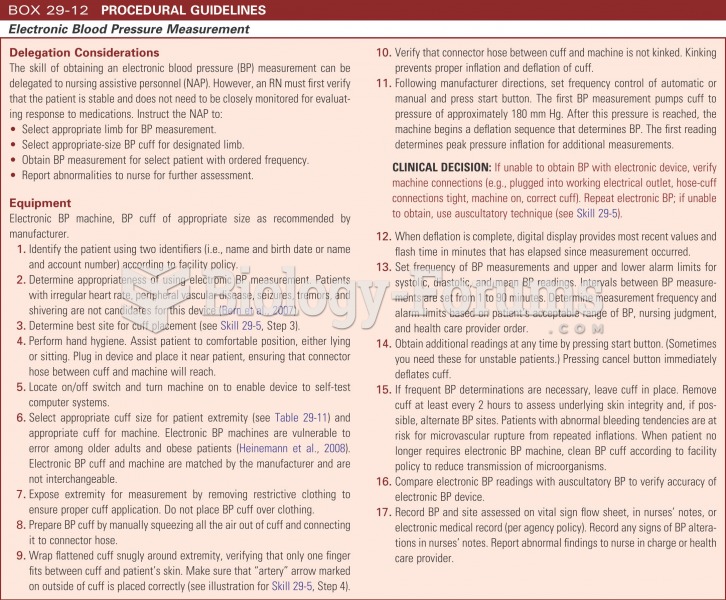 Electronic blood pressure measurement
 Cultural Variations in the Strange Situation Across cultures, most toddlers exhibit secure attachme
 Measuring Attachment Styles: The Strange Situation Experiment
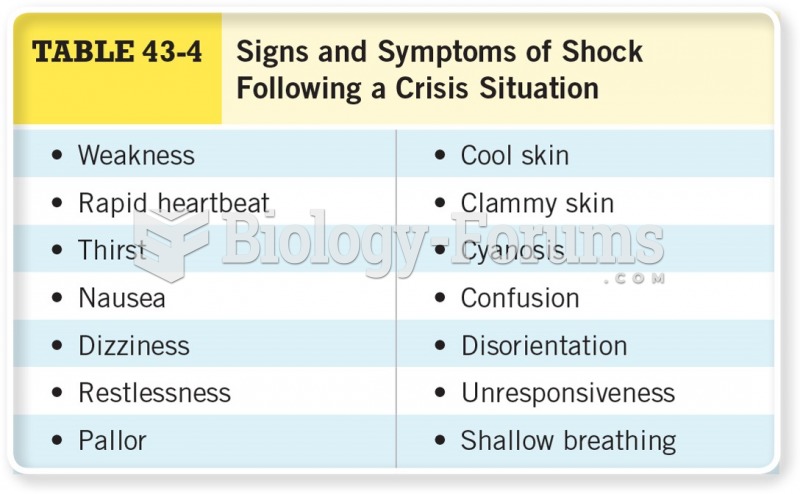 Signs and Symptoms of Shock Following a Crisis Situation