This topic contains a solution. Click here to go to the answer
|
|
|

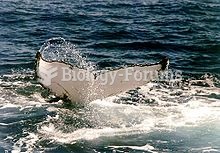 A humpback whale tail displaying wavy rear edges
 Older adults may grieve intensely over the loss of a person or situation that has been a part of the
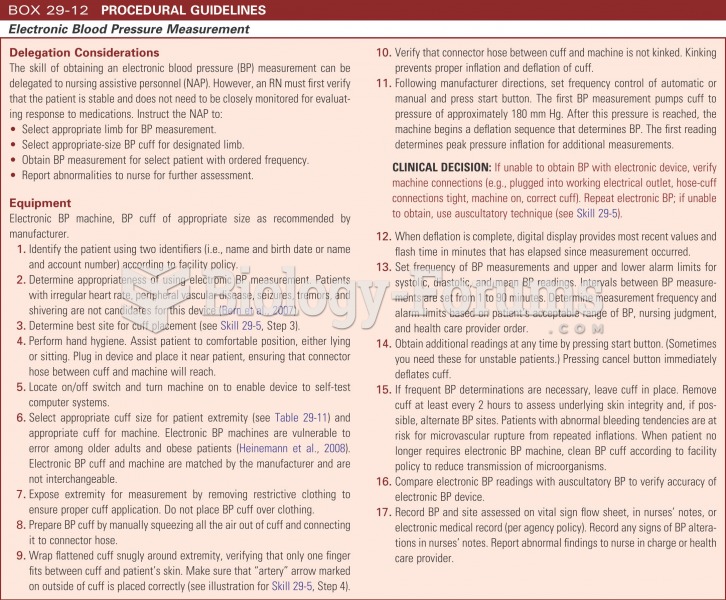 Electronic blood pressure measurement
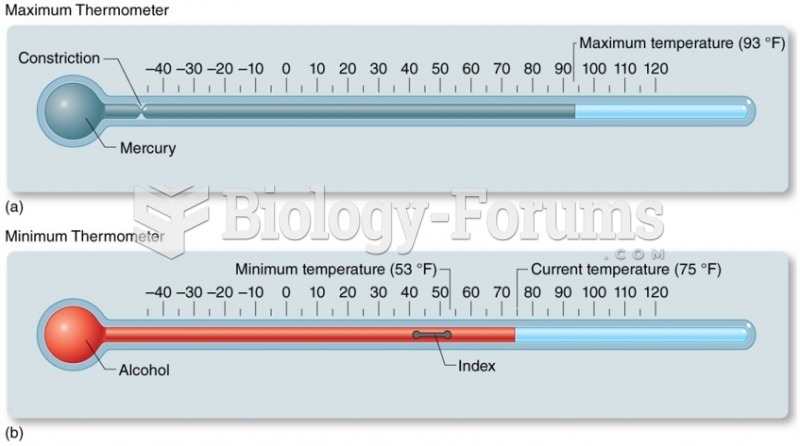 Measurement of Temperature
 How to convert one unit of measurement to another unit (Part 1)
 Measurement and Evaluation in Physical Education and Exercise Science