|
|
|

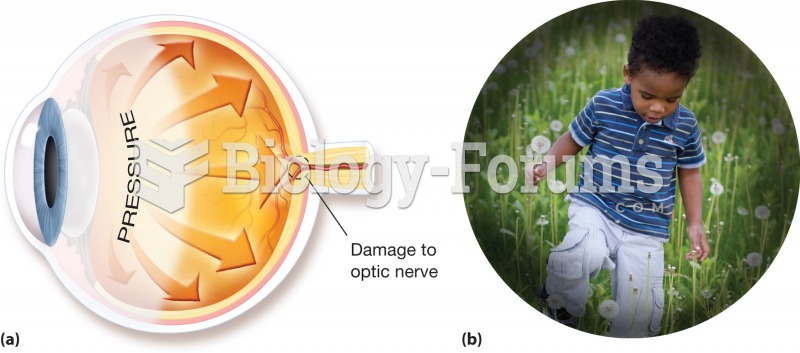 Glaucoma. (a) A buildup of pressure within the eye cavities, often caused by a blockage of vessels t
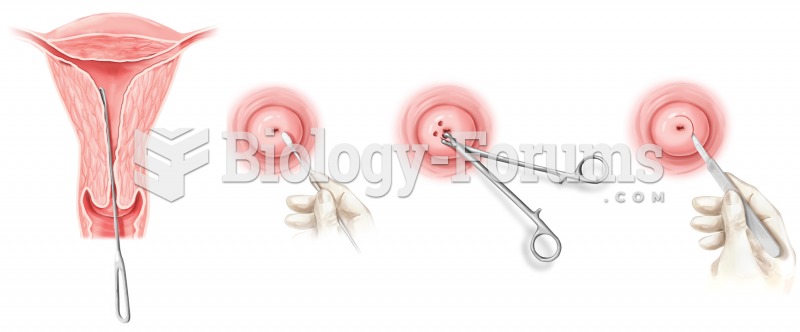 Biopsy. Various forms of gynecological biopsy are shown.
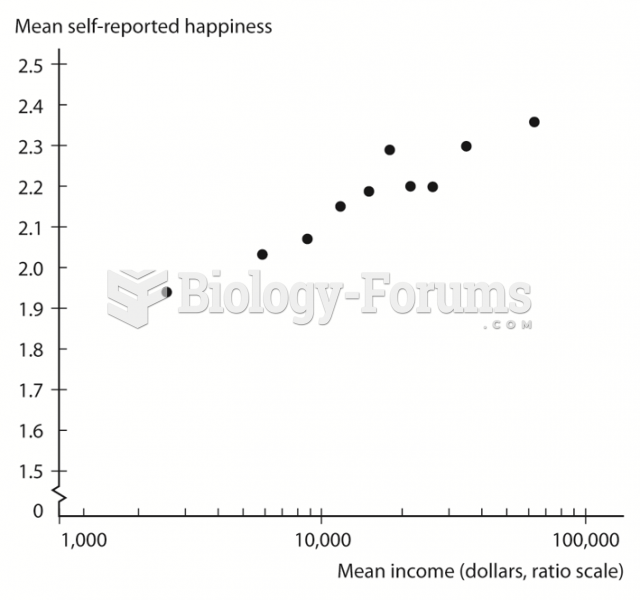 Relationship between Income and Happiness in the United States
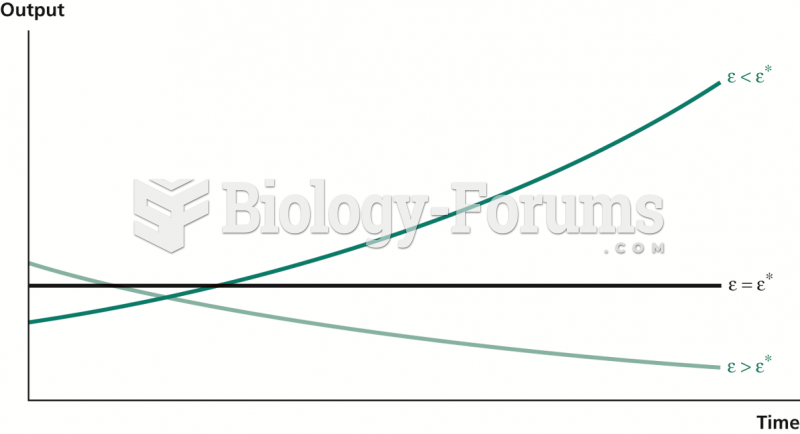 Relationship between Resource Use and Growth
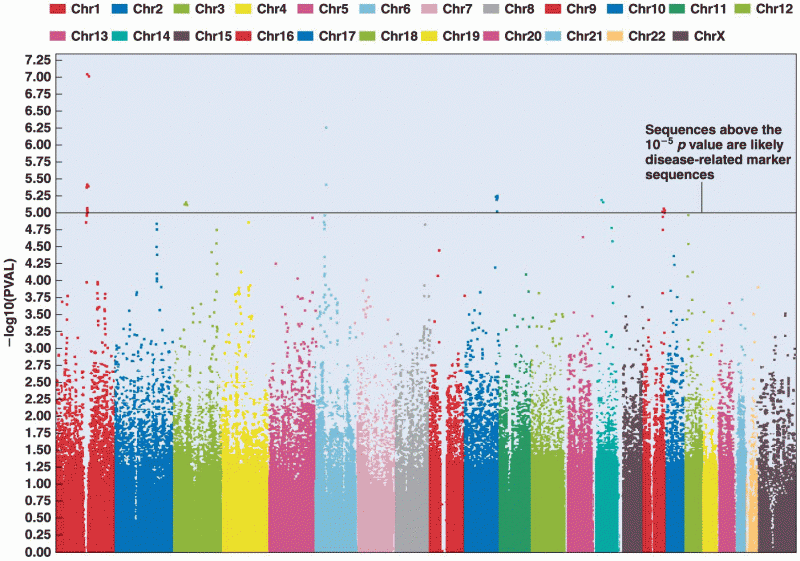 A GWAS study for Type 2 diabetes revealed 386,371 genetic markers, clustered here by chromosome numb
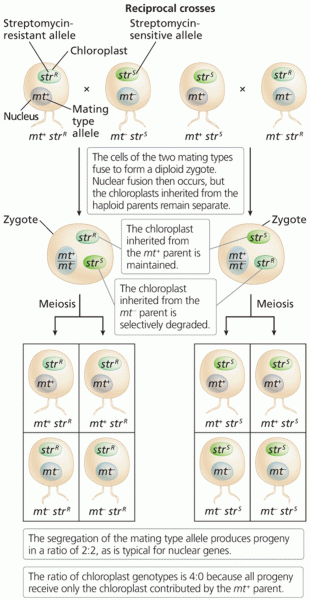 Chloroplast segregation determined by mating type in Chlamydomonas