|
|
|

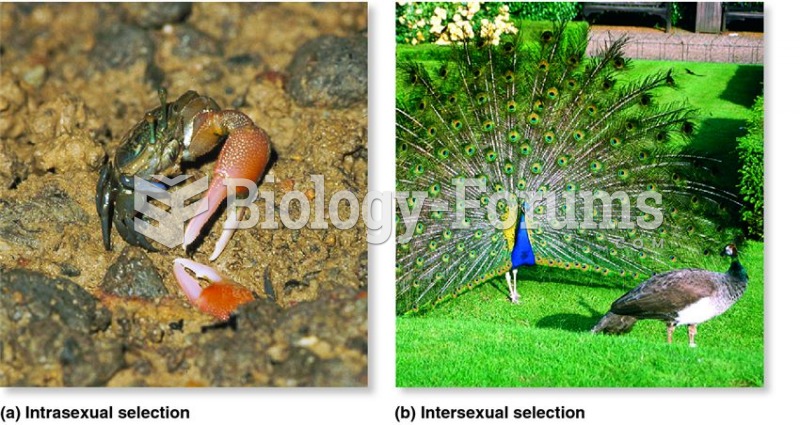 Examples of the results of sexual selection, a type of natural selection.
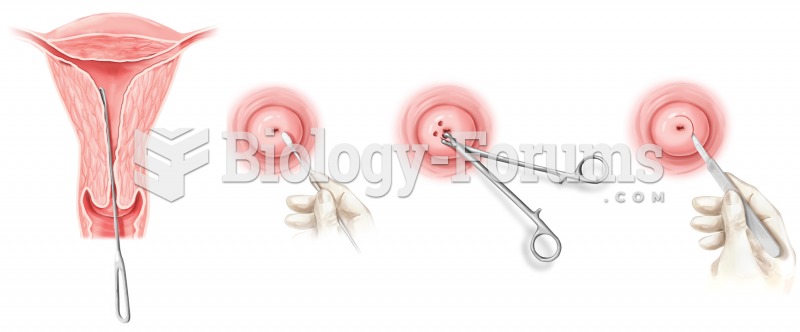 Biopsy. Various forms of gynecological biopsy are shown.
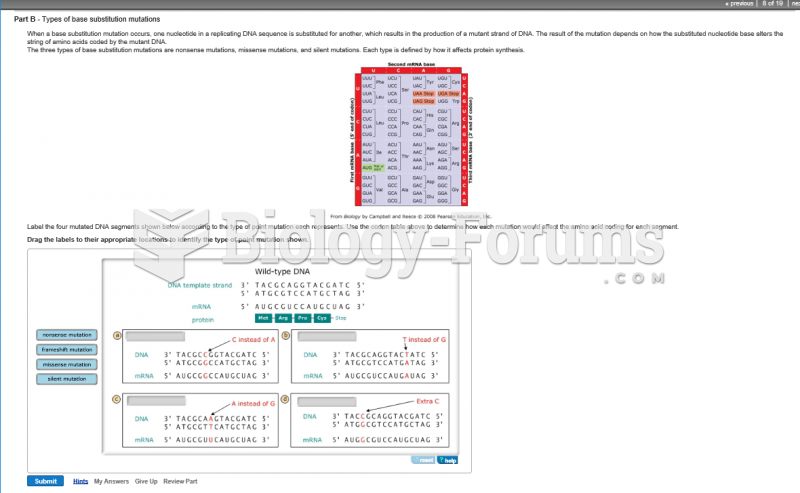 Label the four mutated DNA segments shown below according to the type of point mutation each ...
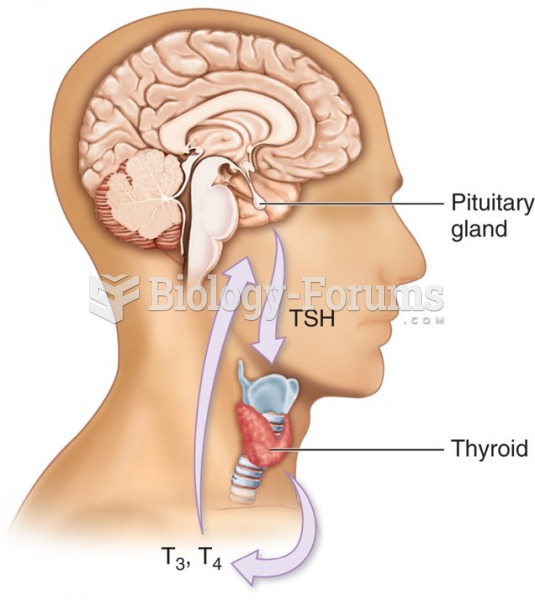 Thyroid hormone production—Relationship between pituitary and thyroid glands. Thyroid hormone ...
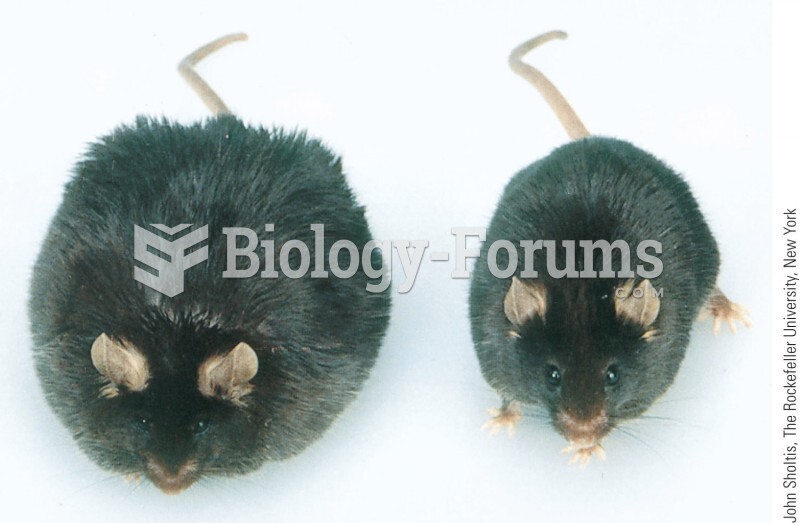 The obese (ob) mouse mutant, shown on the left (a normal mouse is on the right), has provided many c