Did you know?
More than 50% of American adults have oral herpes, which is commonly known as "cold sores" or "fever blisters." The herpes virus can be active on the skin surface without showing any signs or causing any symptoms.
Did you know?
Pink eye is a term that refers to conjunctivitis, which is inflammation of the thin, clear membrane (conjunctiva) over the white part of the eye (sclera). It may be triggered by a virus, bacteria, or foreign body in the eye. Antibiotic eye drops alleviate bacterial conjunctivitis, and antihistamine allergy pills or eye drops help control allergic conjunctivitis symptoms.
Did you know?
There are major differences in the metabolism of morphine and the illegal drug heroin. Morphine mostly produces its CNS effects through m-receptors, and at k- and d-receptors. Heroin has a slight affinity for opiate receptors. Most of its actions are due to metabolism to active metabolites (6-acetylmorphine, morphine, and morphine-6-glucuronide).
Did you know?
GI conditions that will keep you out of the U.S. armed services include ulcers, varices, fistulas, esophagitis, gastritis, congenital abnormalities, inflammatory bowel disease, enteritis, colitis, proctitis, duodenal diverticula, malabsorption syndromes, hepatitis, cirrhosis, cysts, abscesses, pancreatitis, polyps, certain hemorrhoids, splenomegaly, hernias, recent abdominal surgery, GI bypass or stomach stapling, and artificial GI openings.
Did you know?
A cataract is a clouding of the eyes' natural lens. As we age, some clouding of the lens may occur. The first sign of a cataract is usually blurry vision. Although glasses and other visual aids may at first help a person with cataracts, surgery may become inevitable. Cataract surgery is very successful in restoring vision, and it is the most frequently performed surgery in the United States.

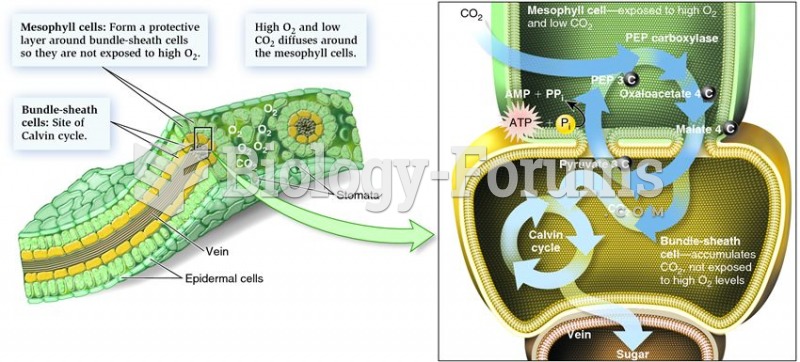 Leaf structure and its relationship to the C4 cycle
 Geoffroy's tamarin has been considered a subspecies of the similar cottontop tamarin, shown abo
 That politics was always a rough business is shown in this cartoon, which shows Lincoln, assisted by
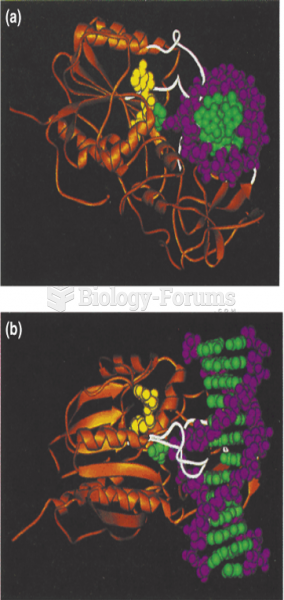 Structure of a complex of a type II DNA methylase with DNA
 A GWAS study for Type 2 diabetes revealed 386,371 genetic markers, clustered here by chromosome numb