This topic contains a solution. Click here to go to the answer
|
|
|

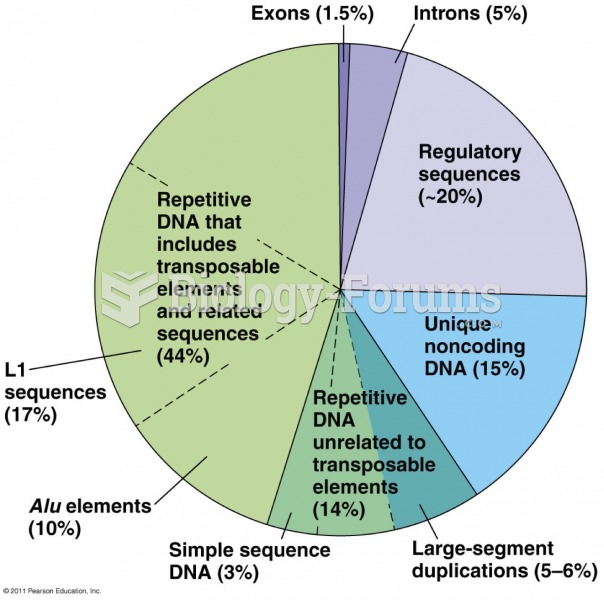 human genome percentage
 Ways to Measure Percentage of Body Fat
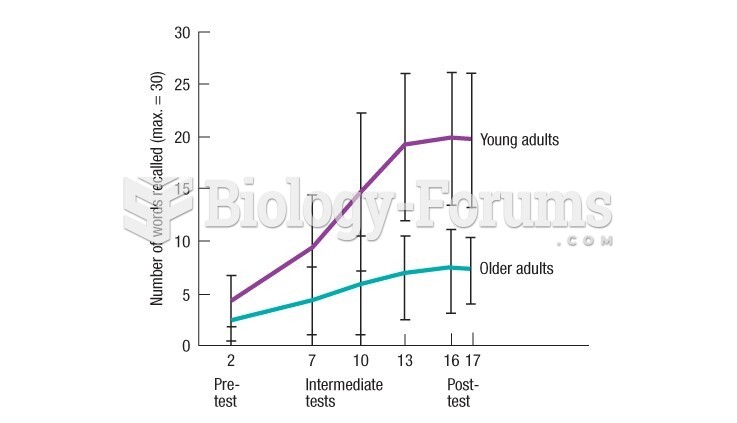 Results from Kliegl's study show that older adults can learn complex information-processing
 An electron is accelerated from rest through a potential difference of 3750 V. It enters a ...
 Newborns, infants, and children have a high percentage of body weight composed of water...