This topic contains a solution. Click here to go to the answer
|
|
|

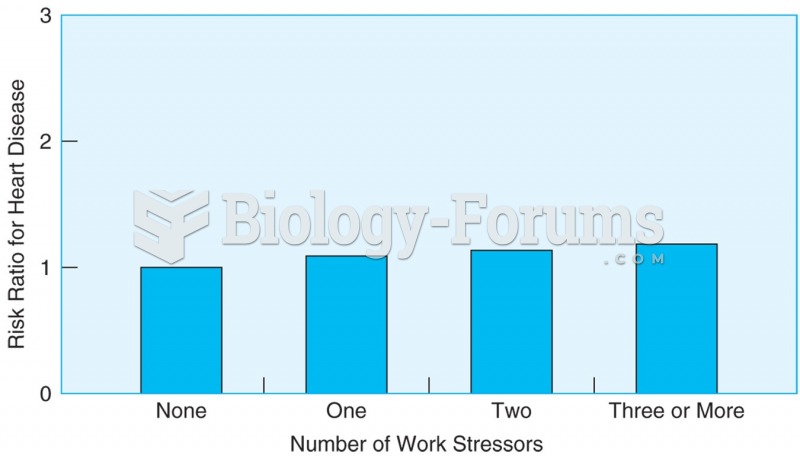 Men who are at risk for heart disease and report work-related stressors are at greater risk of death ...
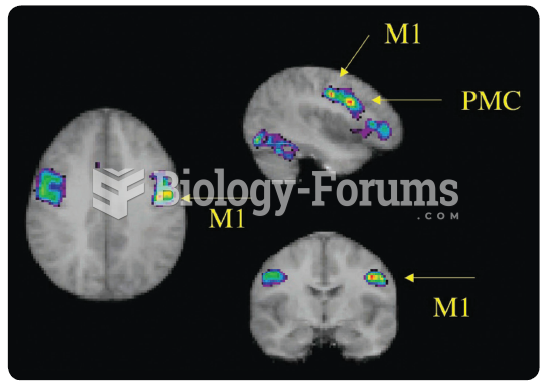 Horizontal, sagittal, and coronal functional MRIs show areas of increased activity in the primary ...
 Alternative Splicing
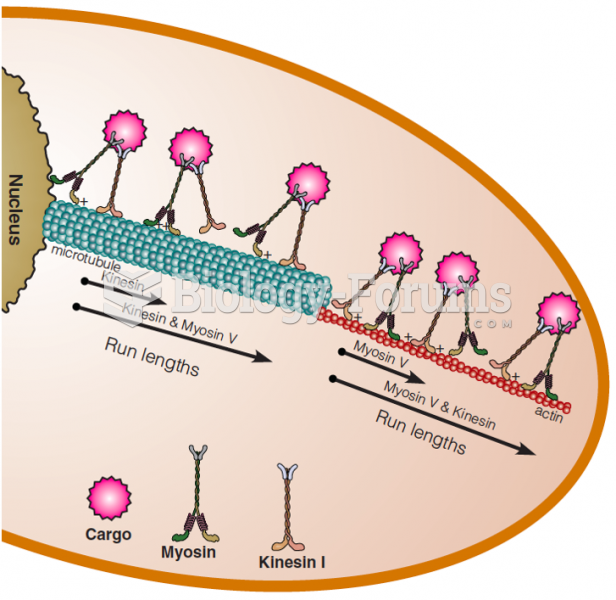 Myosin V and kinesin I work together to deliver cargo
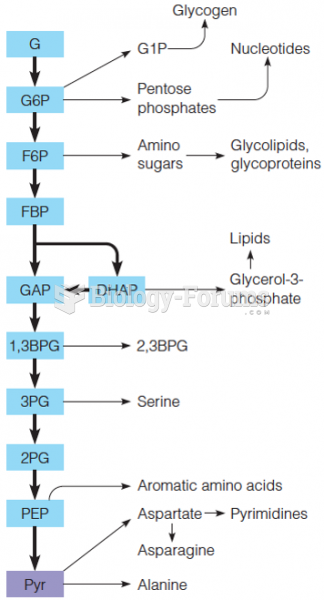 Alternative fates of glycolytic intermediates in biosynthetic pathways
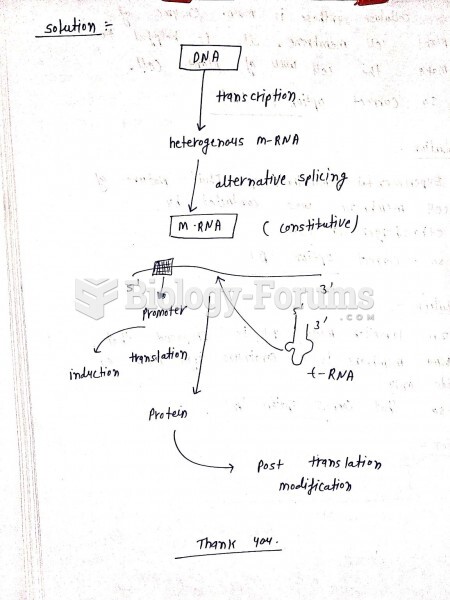 Create a map that integrates the following terms: alternative splicing, constitu