This topic contains a solution. Click here to go to the answer
|
|
|

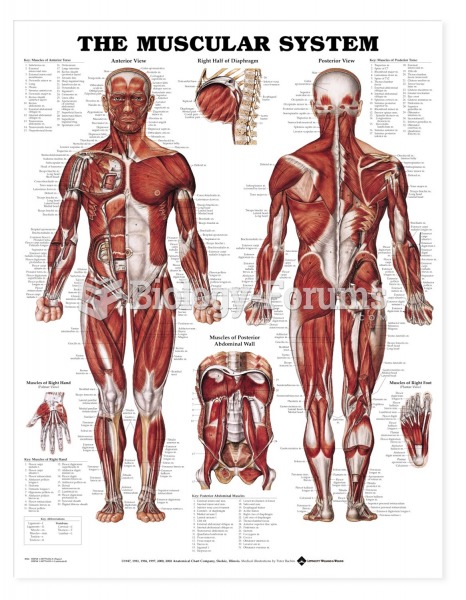 Anatomical Charts Muscular System
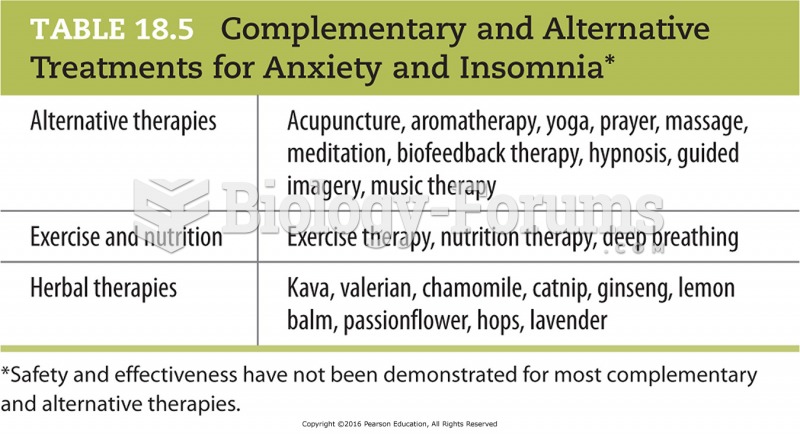 Complementary and Alternative Treatments for Anxiety and Insomnia
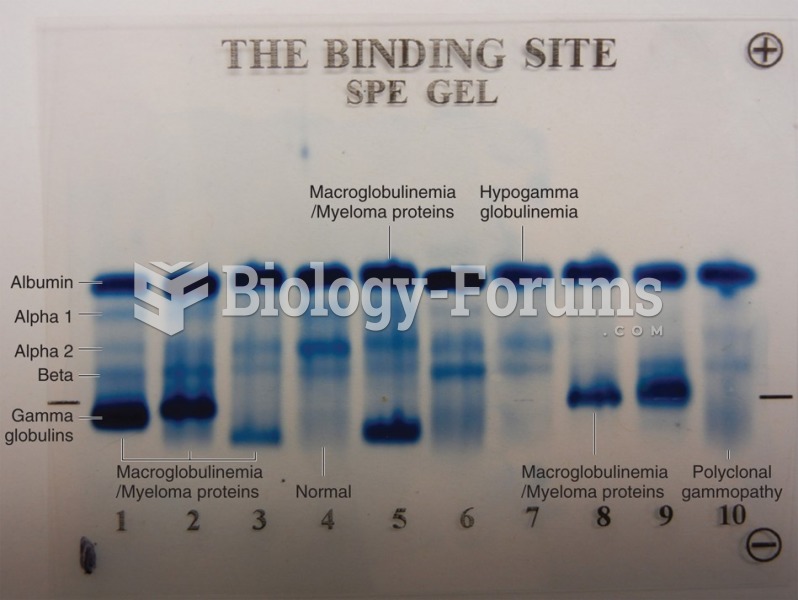 Serum protein electrophoresis gel of 10 sera. Lanes 1, 2, 3, 5, 8, and 9 show evidence of an ...
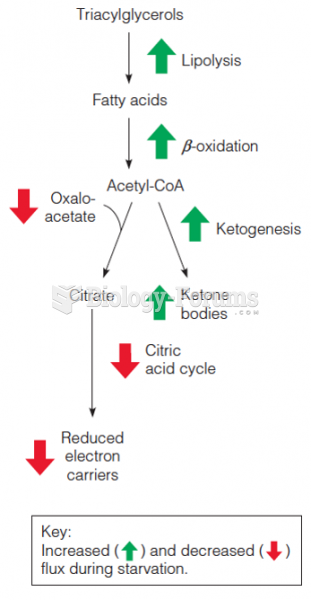 Metabolic adaptations promote alternative fuel use during starvation
 Percentage of Americans Living in Communities with a Fluoridated Water Supply, by State. 2012
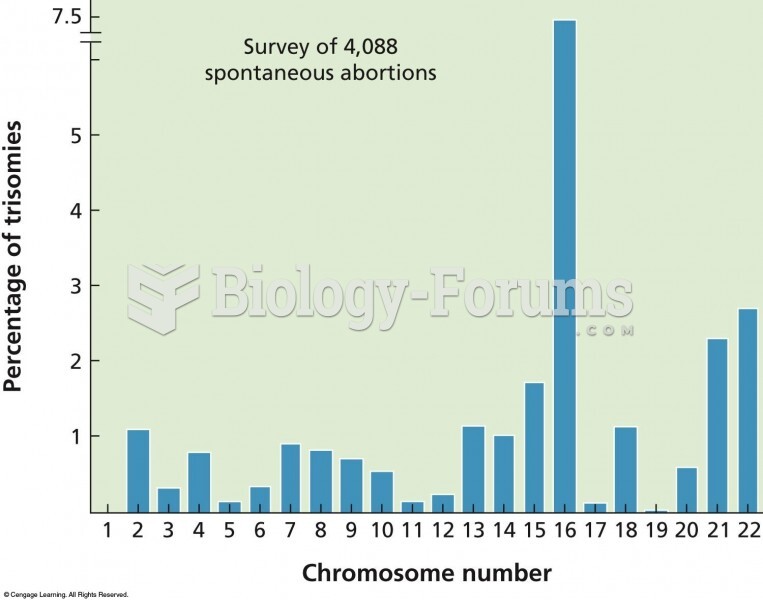 The results of a cytogenetic survey of over 4,000 miscarriages show a wide variation in how often sp