This topic contains a solution. Click here to go to the answer
|
|
|

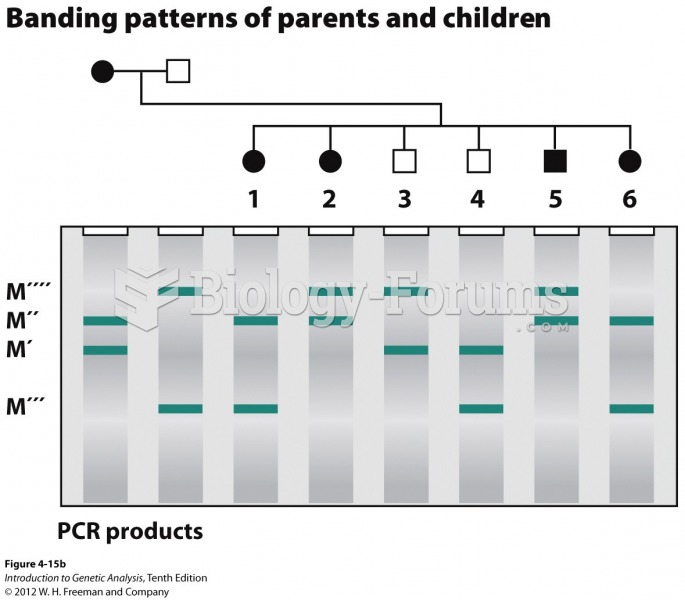 A microsatellite locus can show linkage to a disease gene
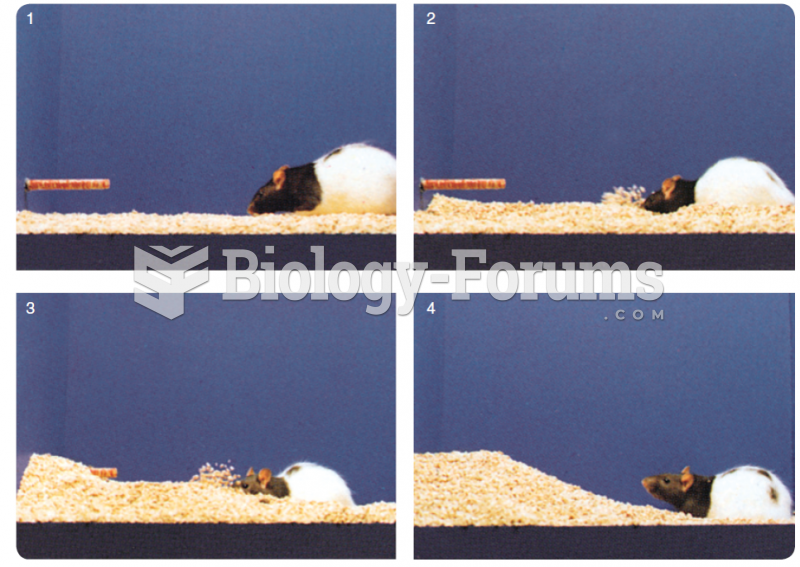 These photos show a rat burying a test object from which it has just received a single mild shock.
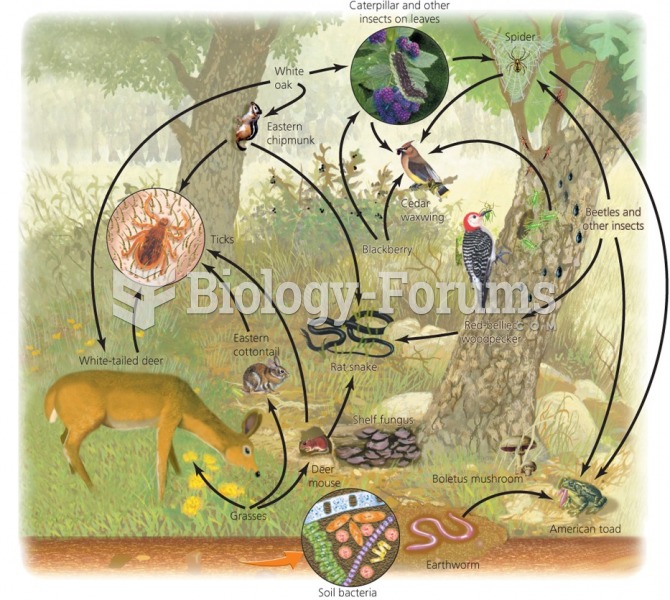 Food webs show feeding relationships and energy flow
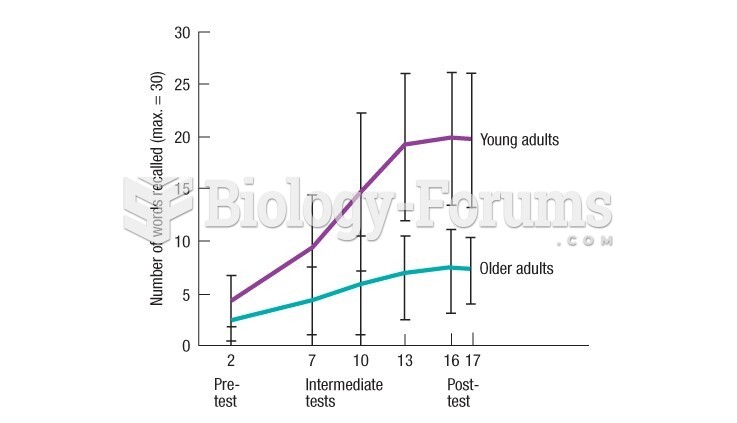 Results from Kliegl's study show that older adults can learn complex information-processing
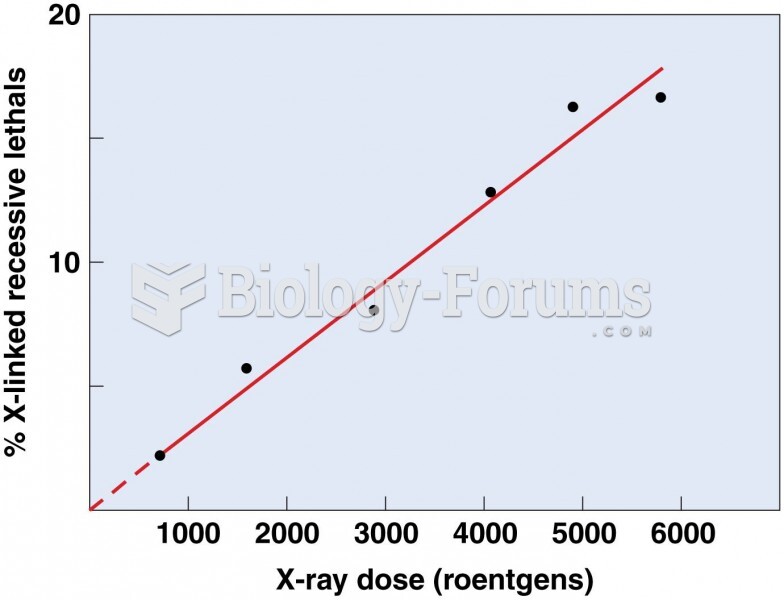 Plot of the percentage of X-linked recessive mutations