|
|
|

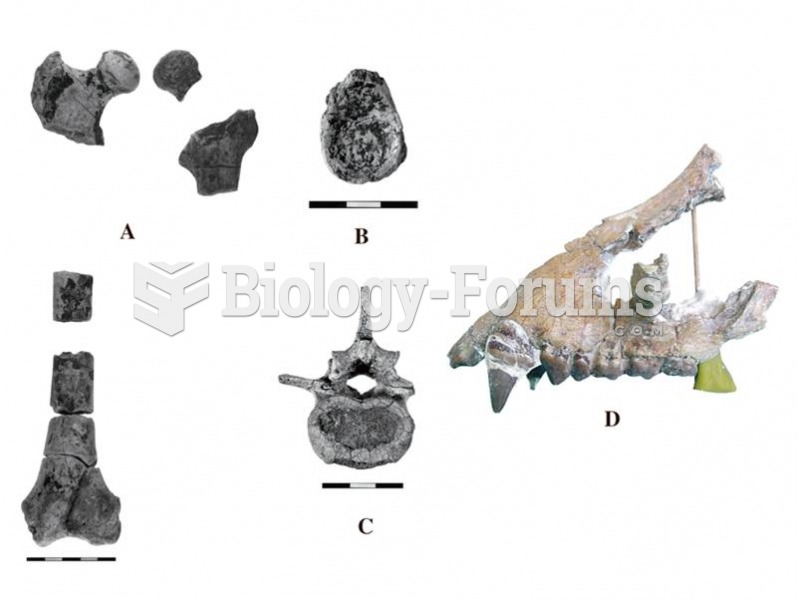 Morotopithecus is the earliest fossil ape to show postcranial adaptations similar to those of the li
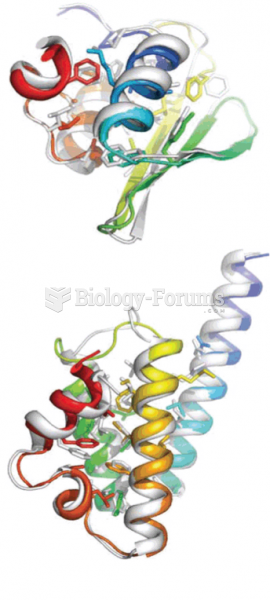 Comparison of de novo predictions to X-ray crystal structures
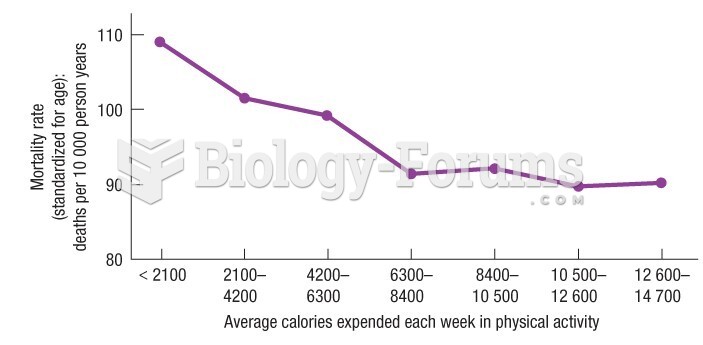 Harvard Alumni Study show who are more physically active in middle adulthood
 Discrete random variables- Probability Distribution Function
 The distribution of the number of hours that a random sample of people spend doing chores per ...
 Lac repressor protein binding. The crystal structural model of Lac repressor binding at lacO