|
|
|

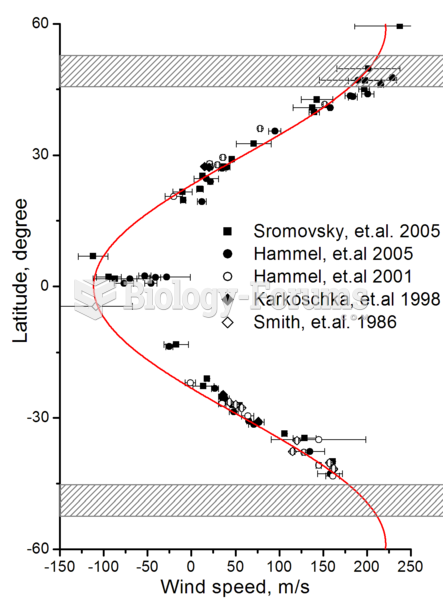 Zonal wind speeds on Uranus. Shaded areas show the southern collar and its future northern counterpa
 13 Ball
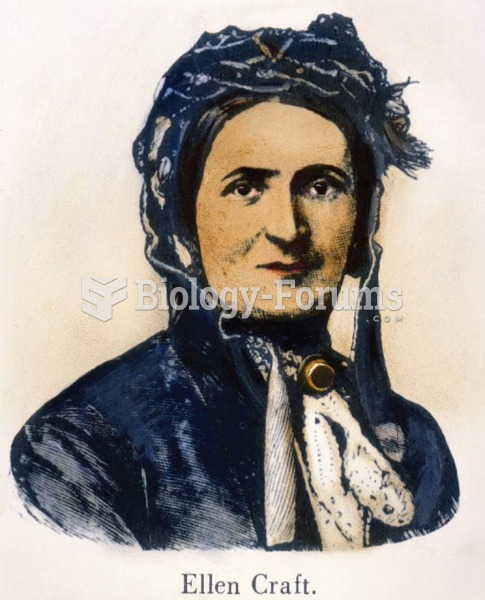 These illustrations show Ellen Craft, a slave with and without a disguise. She dressed “as a disting
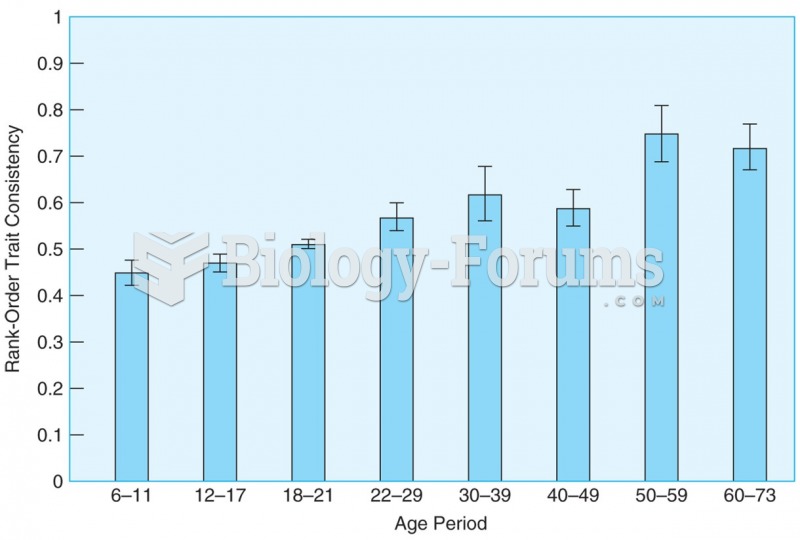 Rank-order correlations show that differential consistency remains high from childhood through late ...
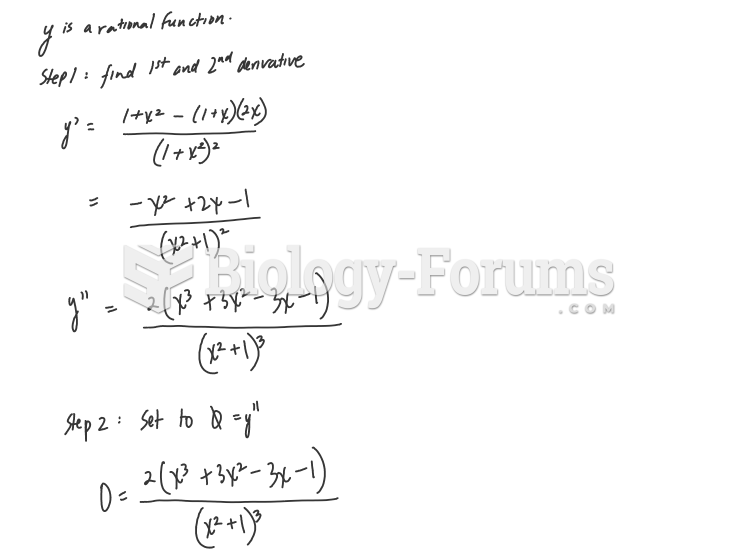 Calculus help: Show that y has three points of inflection and they all lie on...
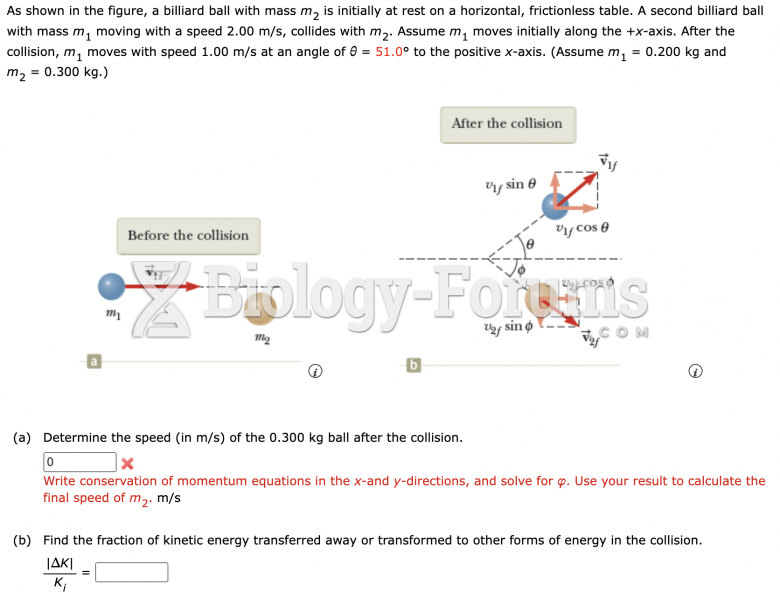 a billiard ball physics question