|
|
|

 Deconvolution fluorescence microscopy yields high-resolution optical sections th
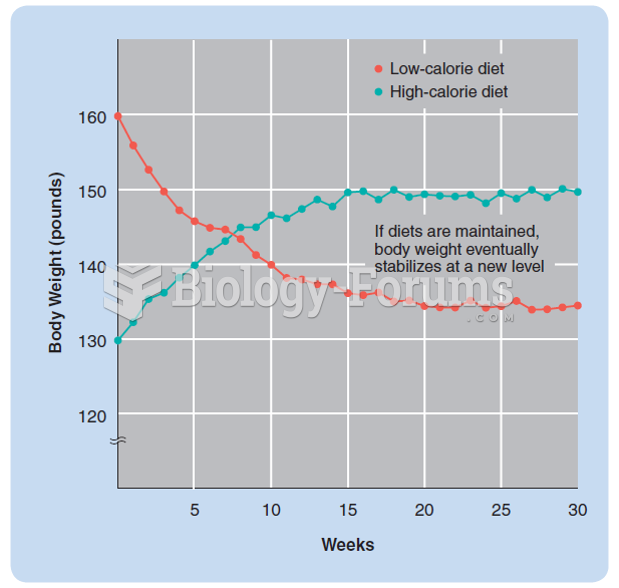 The diminishing effects on body weight of a low-calorie diet and a high-calorie diet.
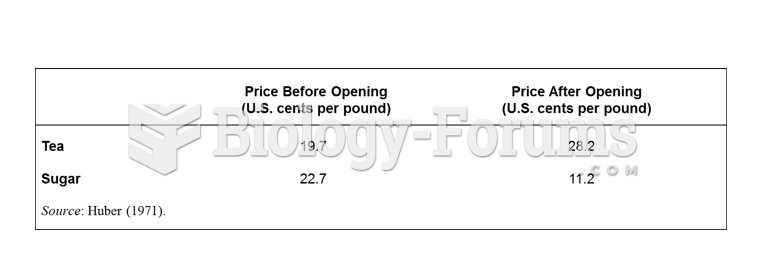 Prices in Japan before and after Opening to Trade
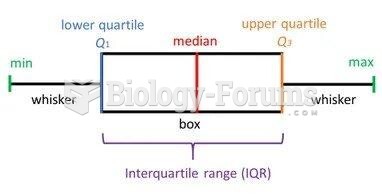 Example of Box-and-Whisker Plot
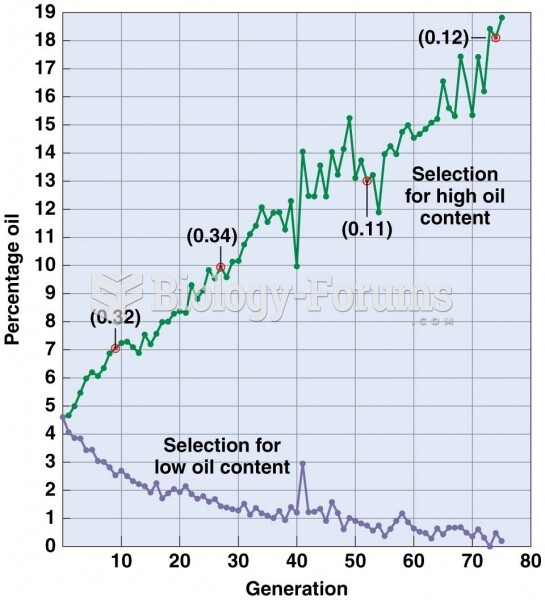 Response of corn selected for high and low oil content over 76 generations
 Plot showing the number of genes on each human chromosome