|
|
|

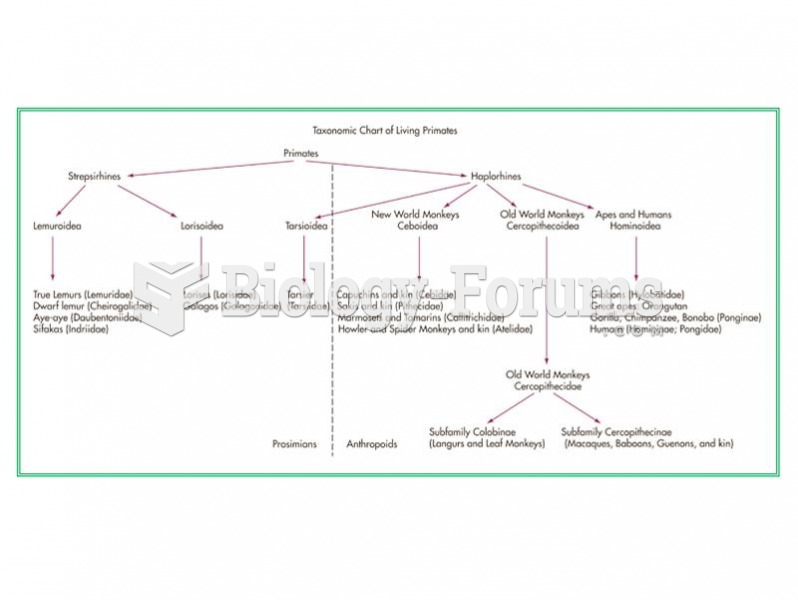 A taxonomic chart of the living primates.
 Membership in this subculture is not easily awarded. Not only must high-steel ironworkers prove that ...
 A chart derived from a flow sheet.
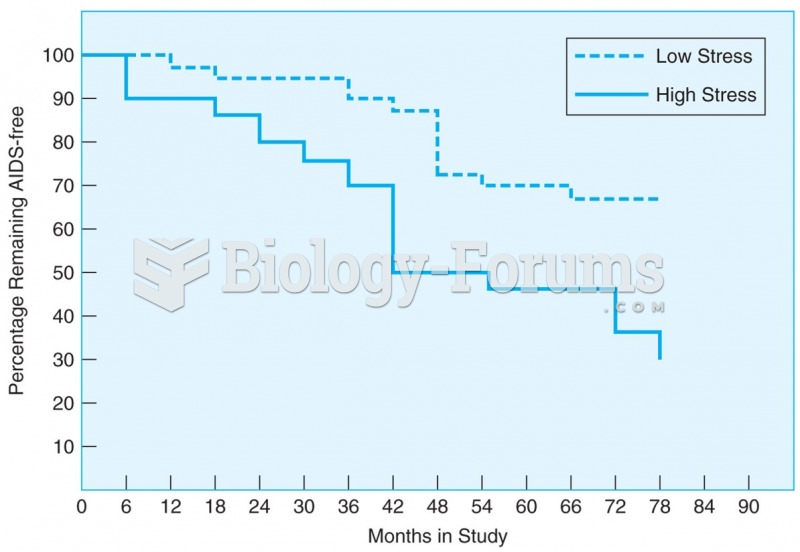 HIV-positive men with a high number of life stressors progress more quickly to AIDS than those with ...
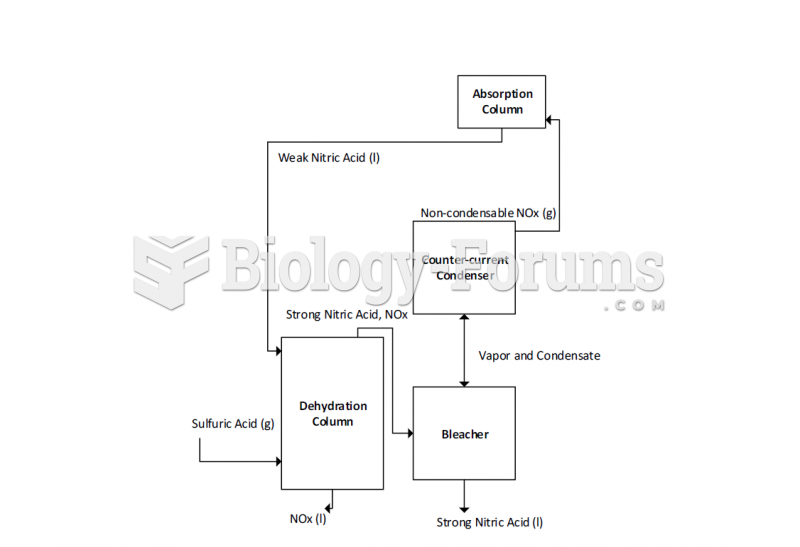 Block Diagram of a High Concentrate Nitric Acid System for Dual-Stage Pressure Production of Nitric