|
|
|

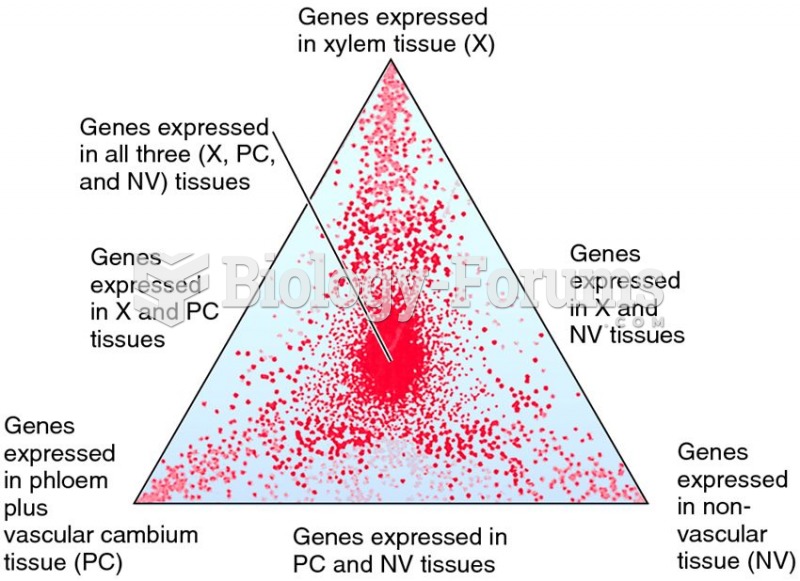 Triangle plot showing gene expression related to xylem, phloem, and nonvascular tissue in Arabidopsi
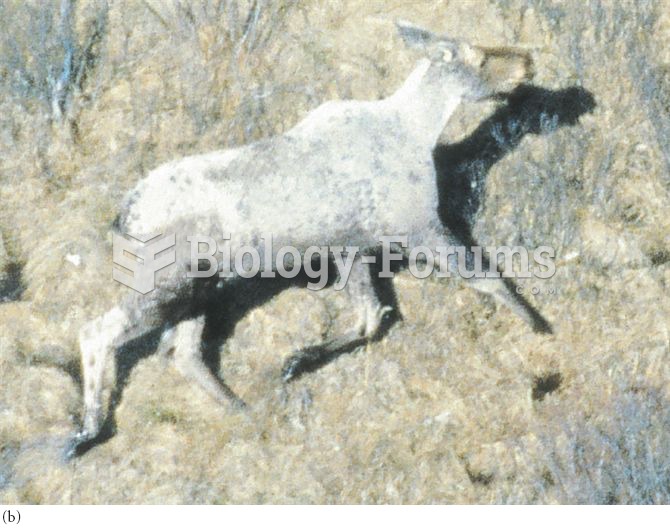 (a) With few ticks, moose retain a brown coat; (b) at high numbers of ticks, moose self-groom, destr
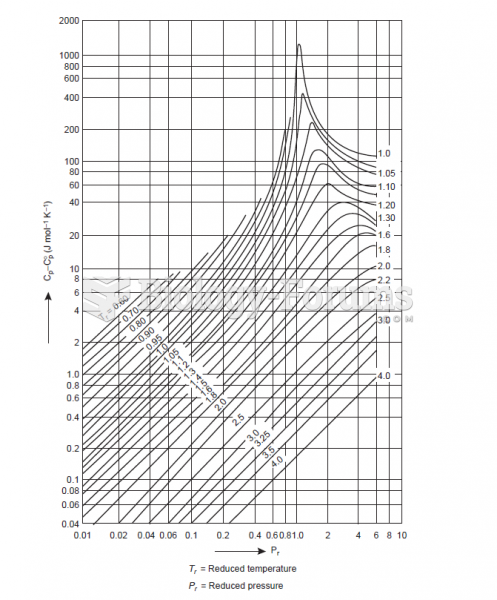 Excess heat capacity chart
 How to plot a cosine function containing an amplitude and phase-shift (Question 2 of 2)
 Eating calcium-rich foods daily assists with bone health, muscle contraction, and blood clotting
 Newborns, infants, and children have a high percentage of body weight composed of water...