|
|
|

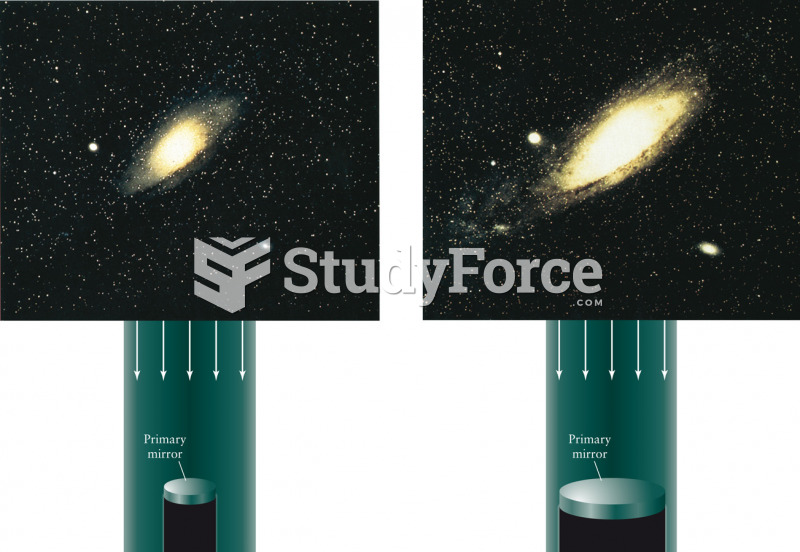 Light-Gathering Power
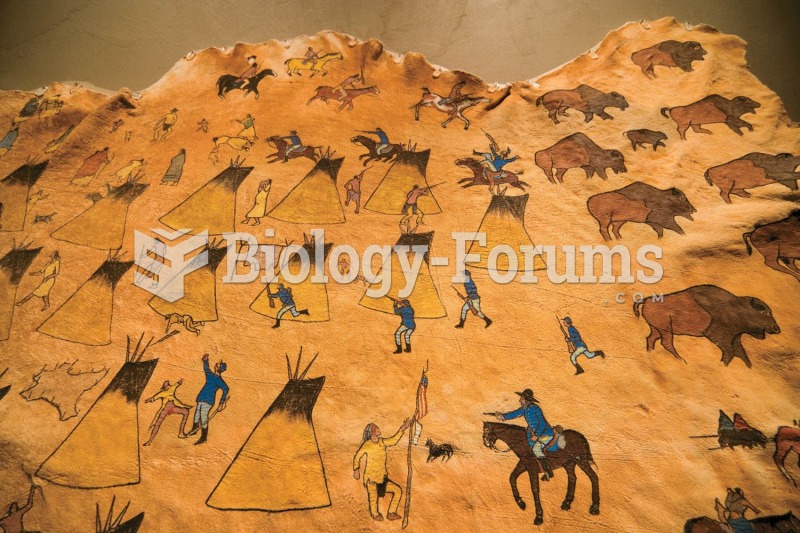 This Native American depiction of the Sand Creek Massacre, painted on a buffalo hide, shows the Indi
 The Wug Test
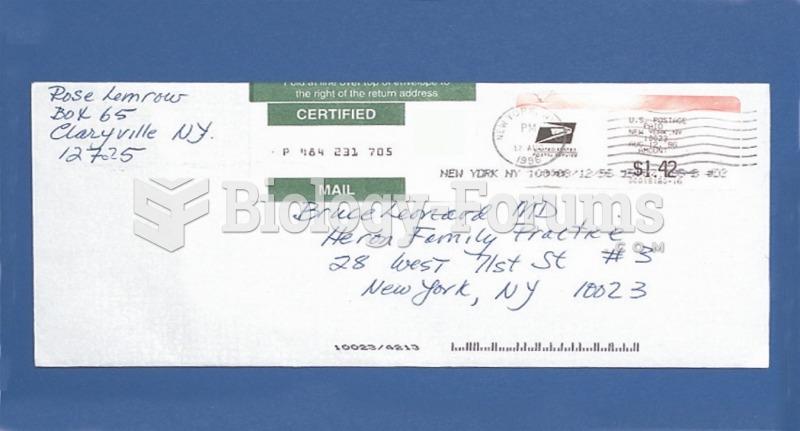 Items that would be difficult to replace bearing legal significance are sent by certified mail.
 Passive stretching enhances joint function.
 How to describe transformations of a sinusoidal function (y=a*sinb(x−c)+d)