|
|
|

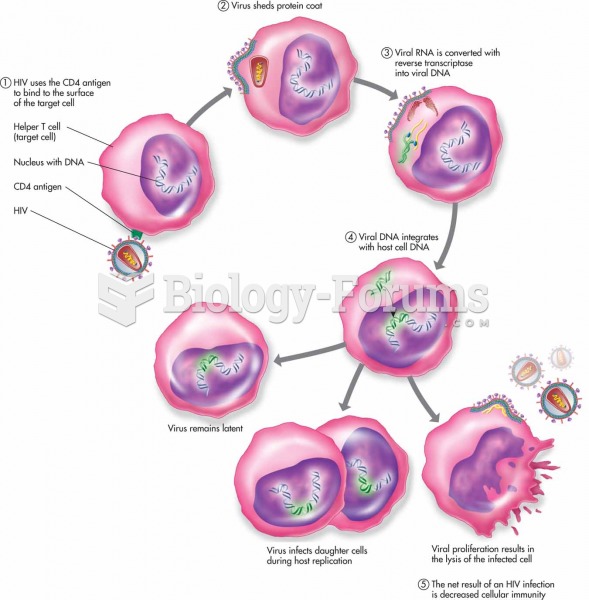 Human immunodeficiency virus gains entry into helper T cells, uses the cell DNA to replicate, interf
 Triceps Reflex Test
 The end of a typical line wrench, which shows that it is capable of grasping most of the head of ...
 How to perform the concavity test and second derivative test for a function (Part 2)
 Using the Power Rule for Derivatives
 A car wash reduced the price of a basic wash as a promotion and test of the market. With the ...