|
|
|

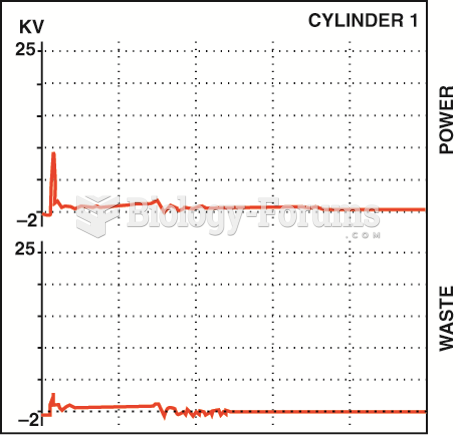 A dual-trace scope pattern showing both the power and the waste spark from the same coil ...
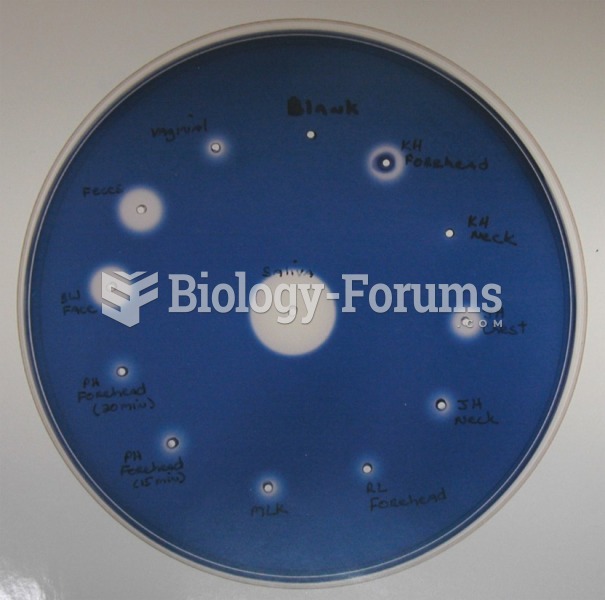 Starch iodine test for alpha amylase.
 One Minute Sit-up Test for Abdominal Muscle Strength and Endurance.
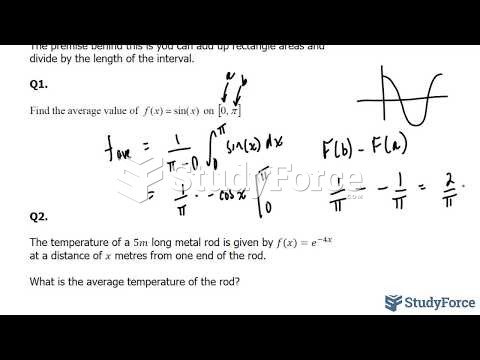 How to find the average value of a function
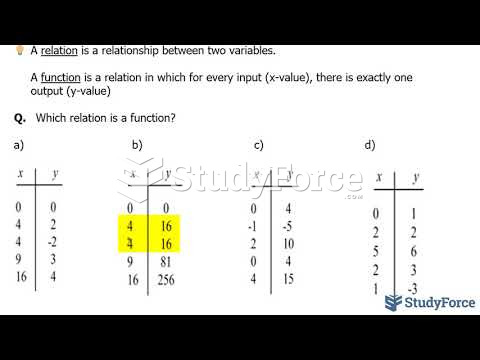 How to determine if a table of values represents a function
 How to combine and sketch transformations of a sinusoidal function (Question 1) (y=a*sinb(x−c)+d)