This topic contains a solution. Click here to go to the answer
|
|
|

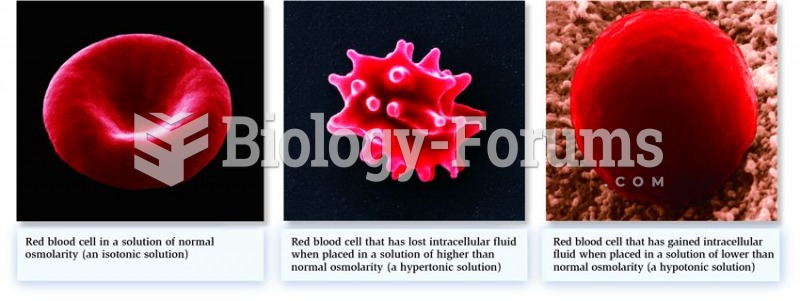 Changes in cell shape due to alterations in intracellular fluid volume.
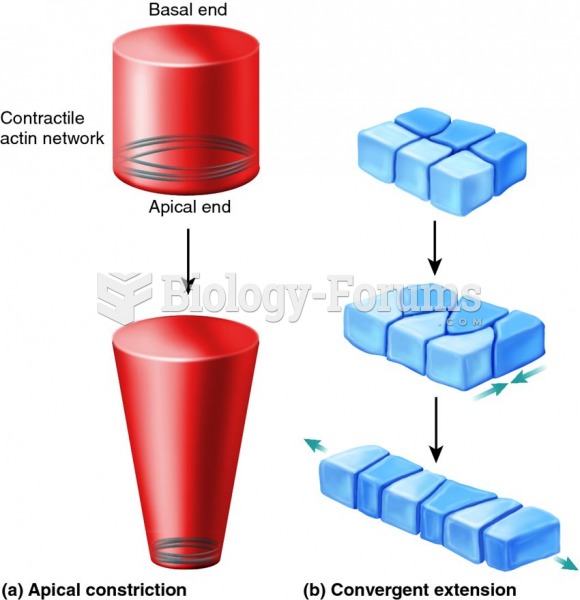 Two mechanisms that affect cell shape and movement.
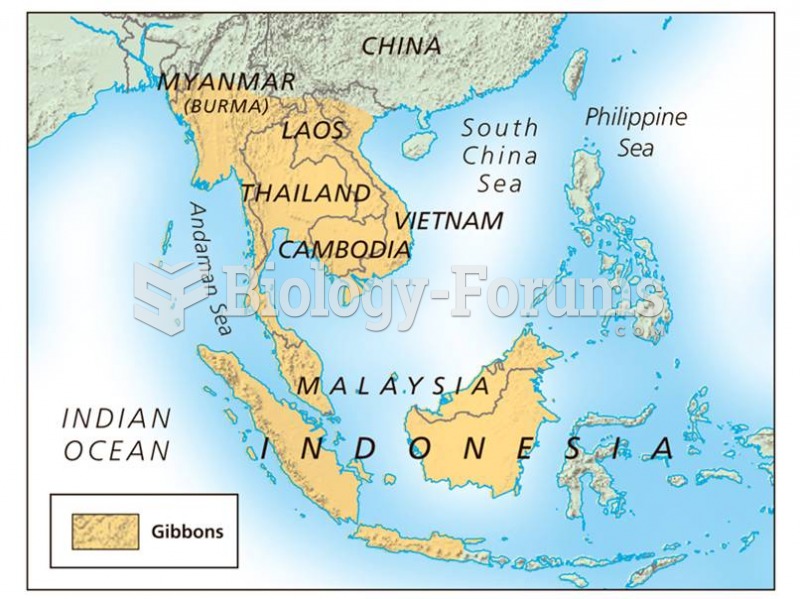 Distribution of the gibbons.
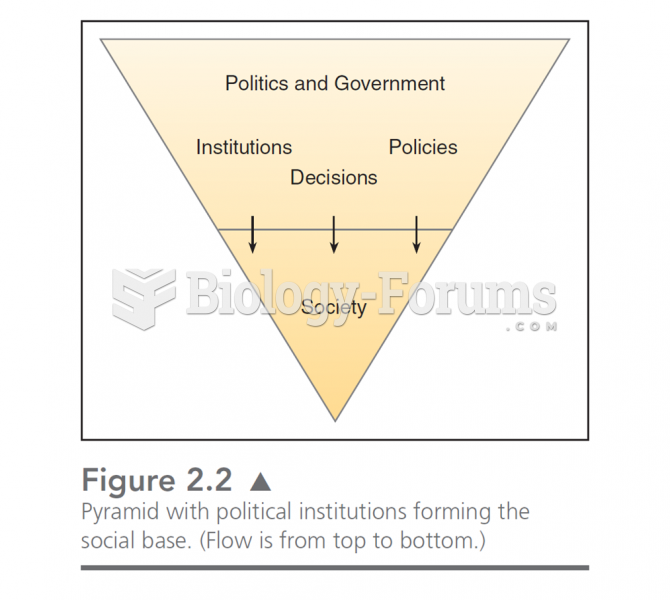 This chart illustrates the “drip down” model of government. In this, politics is formed by the soc
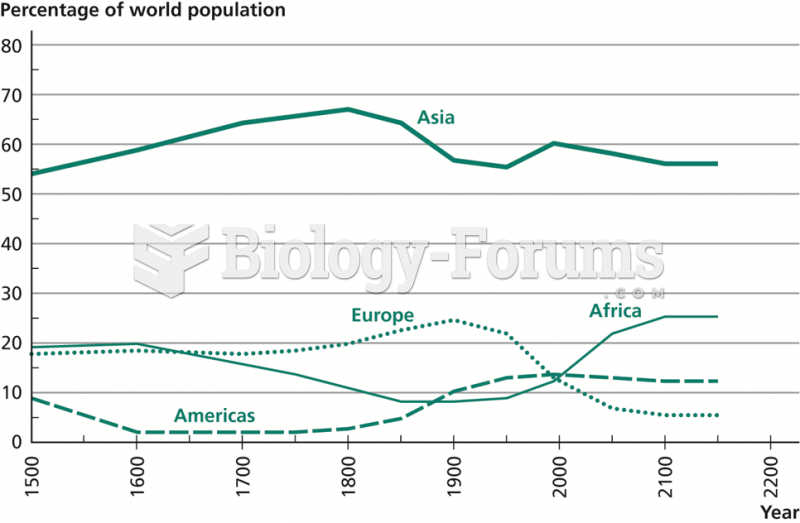 Distribution of the World’s Population
 Spacecraft optimum geometrical shape