|
|
|

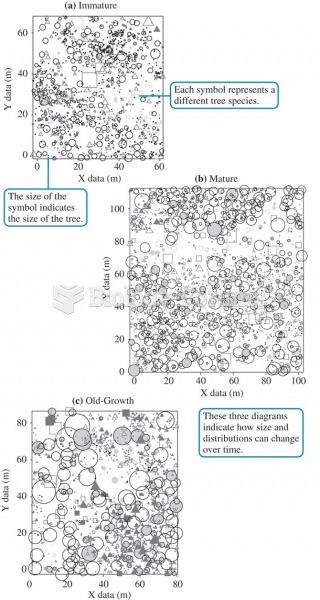 The spatial distribution of trees in three separate stands of different ages on Vancouver Island (da
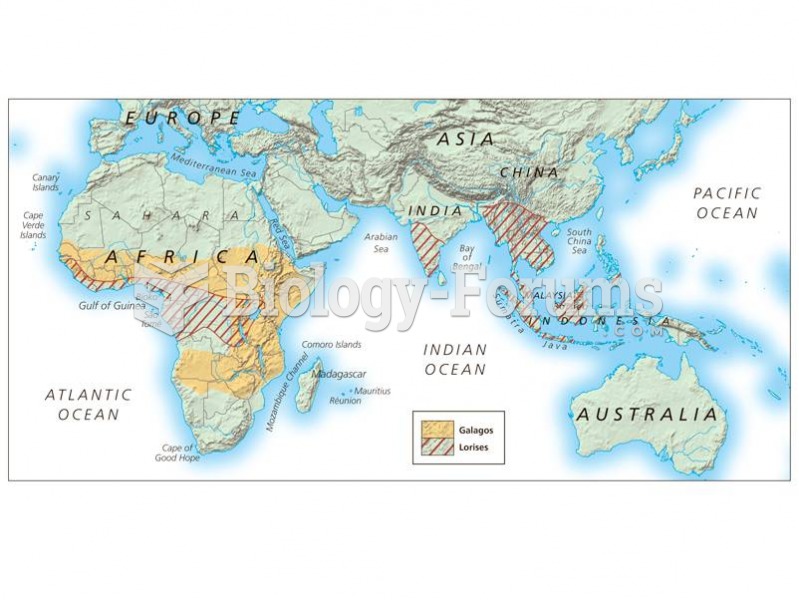 The distribution of lorsies and galagos.
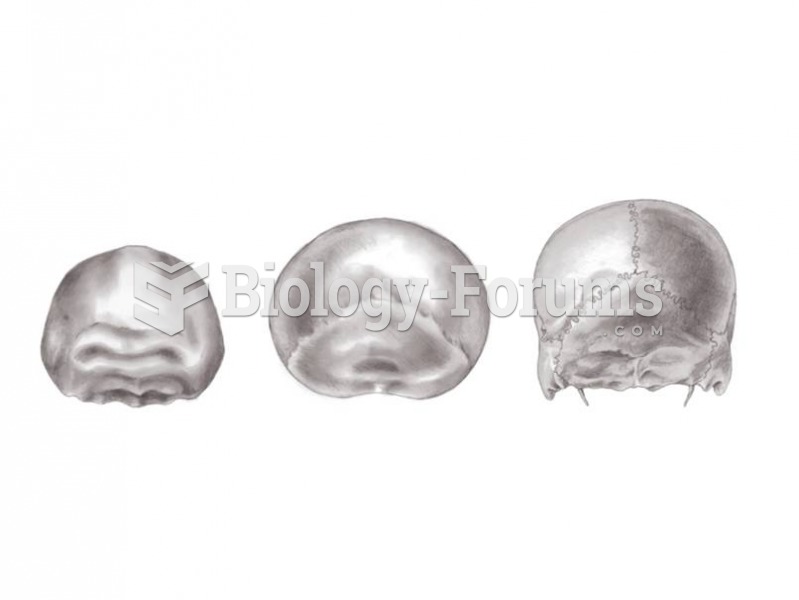 Posterior views of H. erectus, Neandertal, and modern H. sapiens show differences in vault shape.
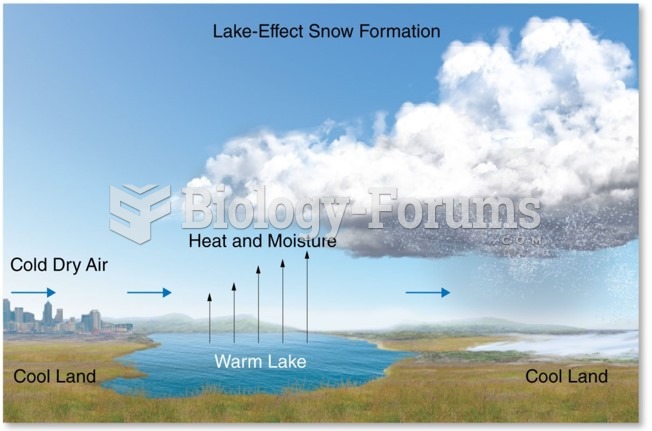 Distribution and Forms of Precipitation: Snow
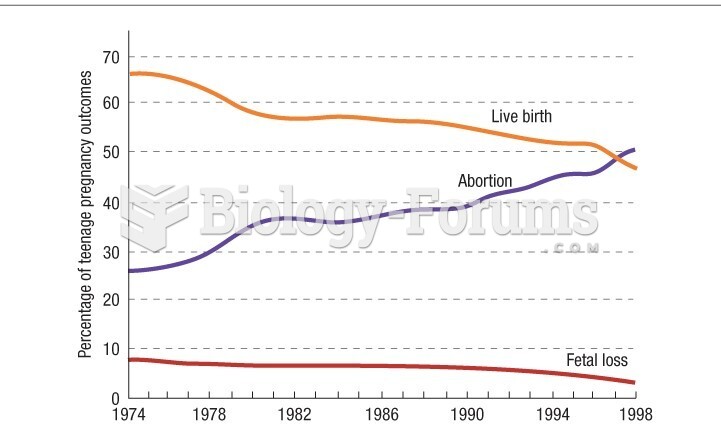 Percentage distribution of outcomes of teenaged pregnancy
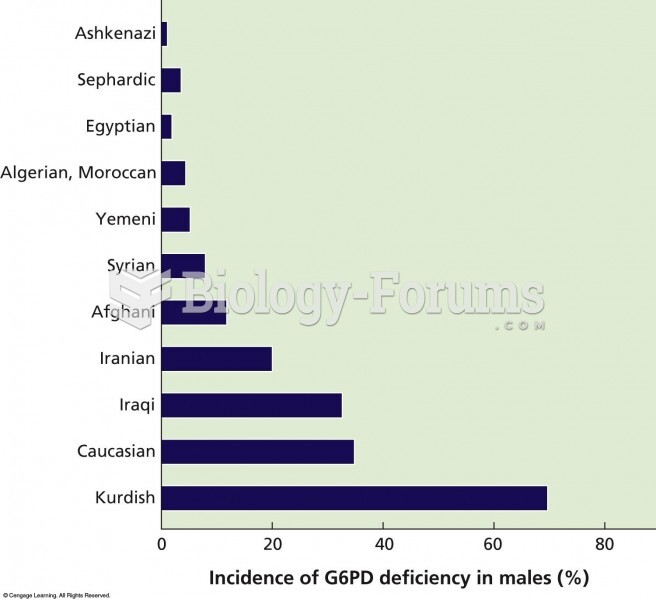 Distribution of glucose-6-phosphate dehydrogenase (G6PD) deficiency in various Jewish populations. B