|
|
|

 Edward Bellamy, author of the utopian novel Looking Backward (1888) Bellamy’s socialism worried many
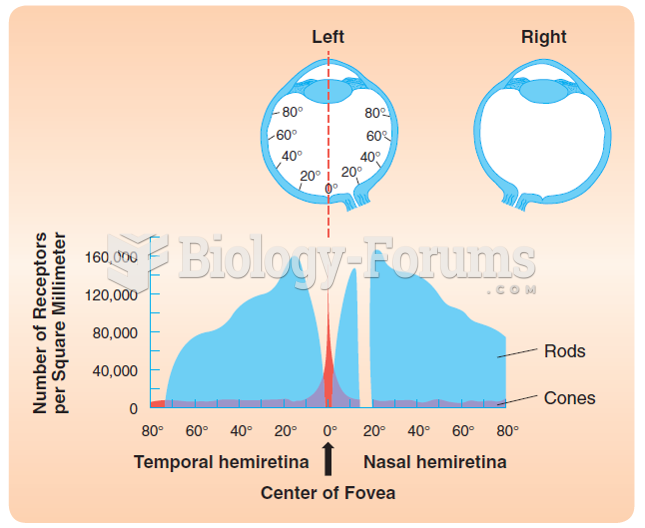 The distribution of cones and rods over the human retina. The figure illustrates the number of cones ...
 Distribution and Forms of Precipitation: Snow
 Fluidization - Concentration NaOH Chart
 Chart
Chart
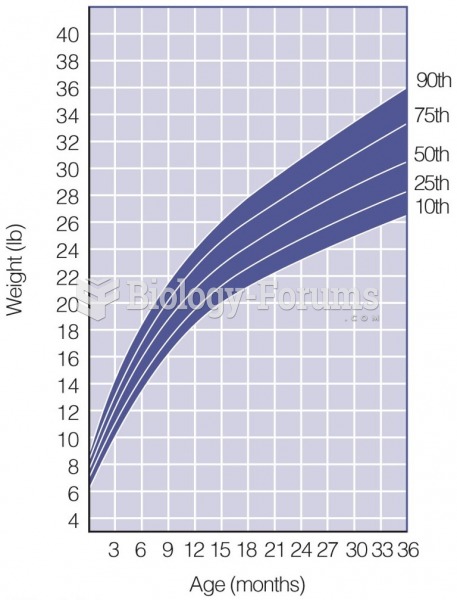 Growth Chart