|
|
|

 The cranium of a young infant changes dramatically in shape with age. Initially the child has severa
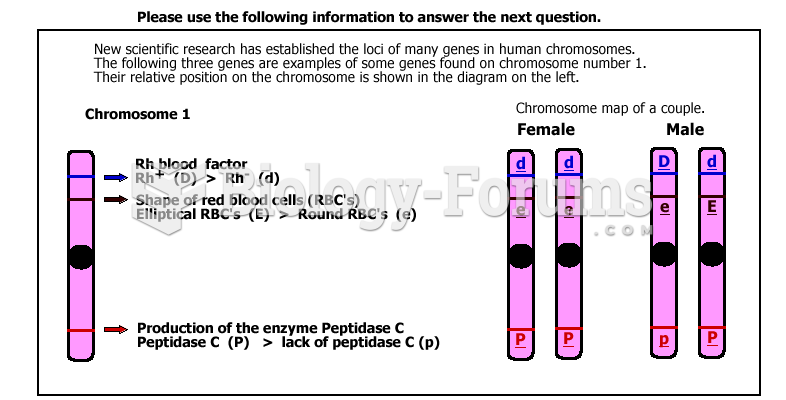 Chart to answer QN
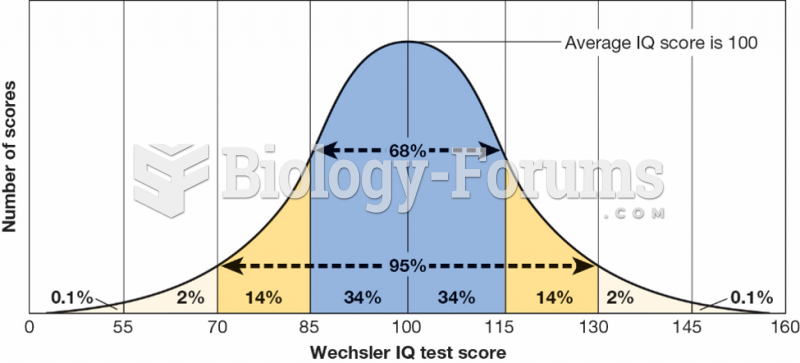 Normal Distribution of IQ Scores
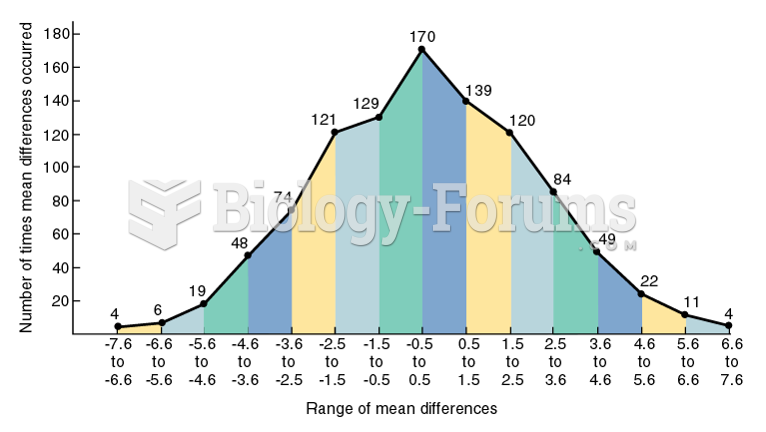 A Frequency Distribution
 Complete the following production chart and plot the points.
 The distribution of Neandertal and Denisovan DNA in the modern human genome