This topic contains a solution. Click here to go to the answer
|
|
|

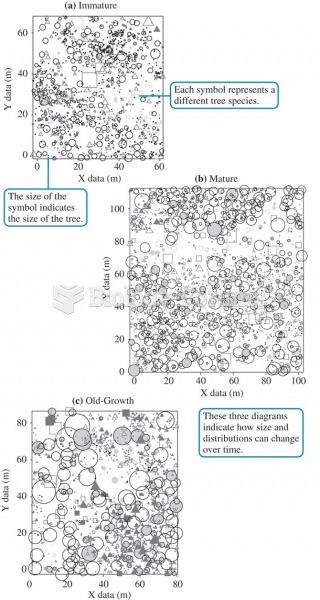 The spatial distribution of trees in three separate stands of different ages on Vancouver Island (da
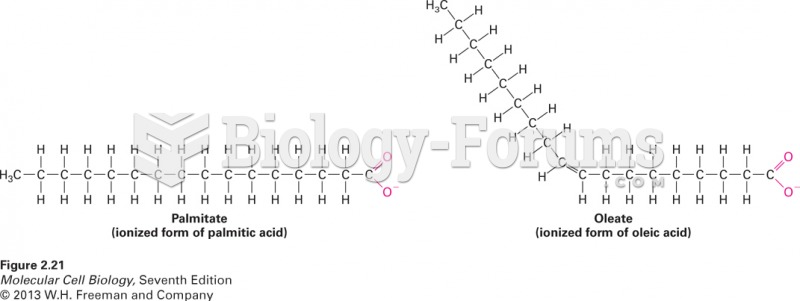 The effect of a double bond on the shape of fatty acids
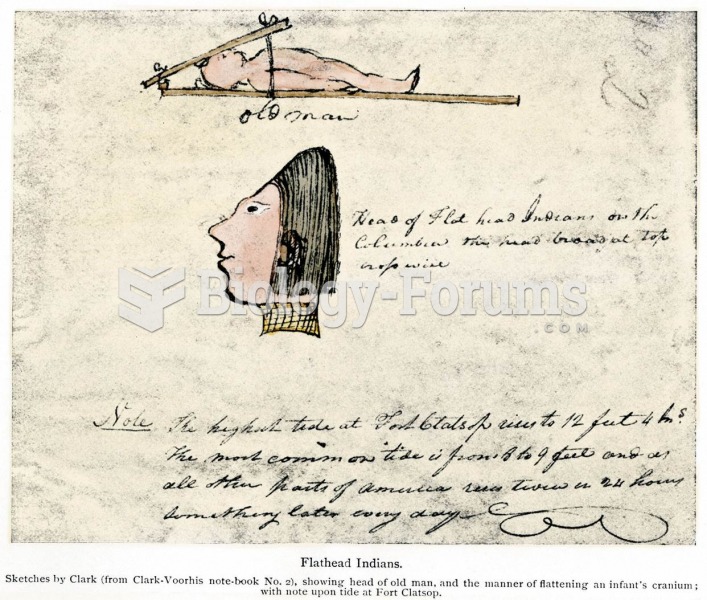 The “Flat Head” (Chinook) Indians acquired their name through shaping in infancy, as shown in a diag
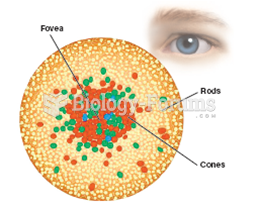 Distribution of Rods and Cones on the Retina
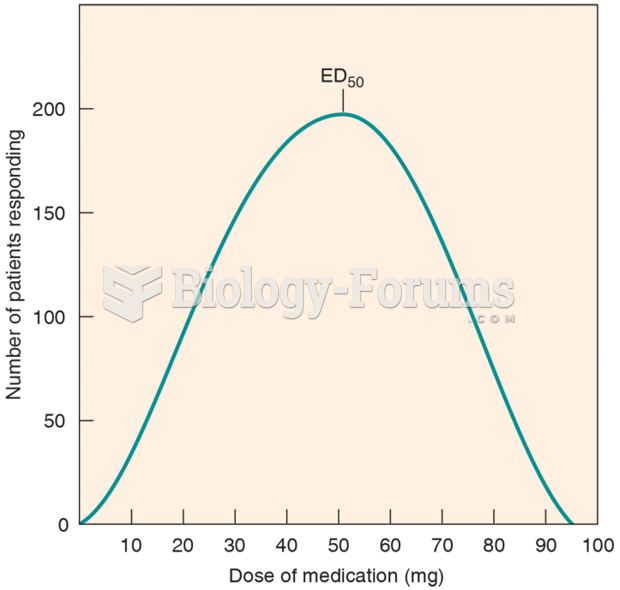 The Frequency Distribution Curve of a Drug
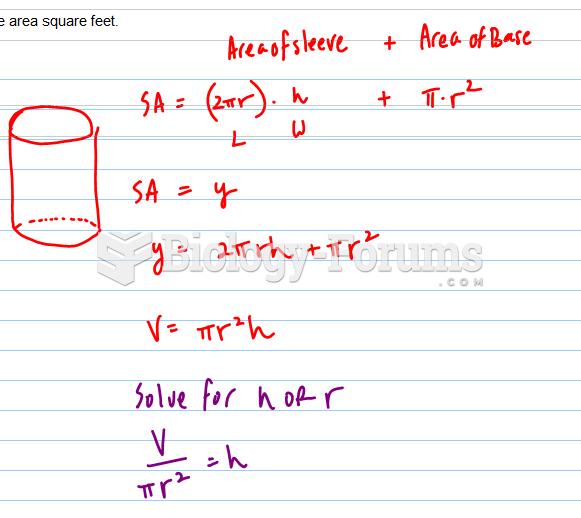 A container in the shape of a right circular cylinder with no top has surface area square feet.