|
|
|

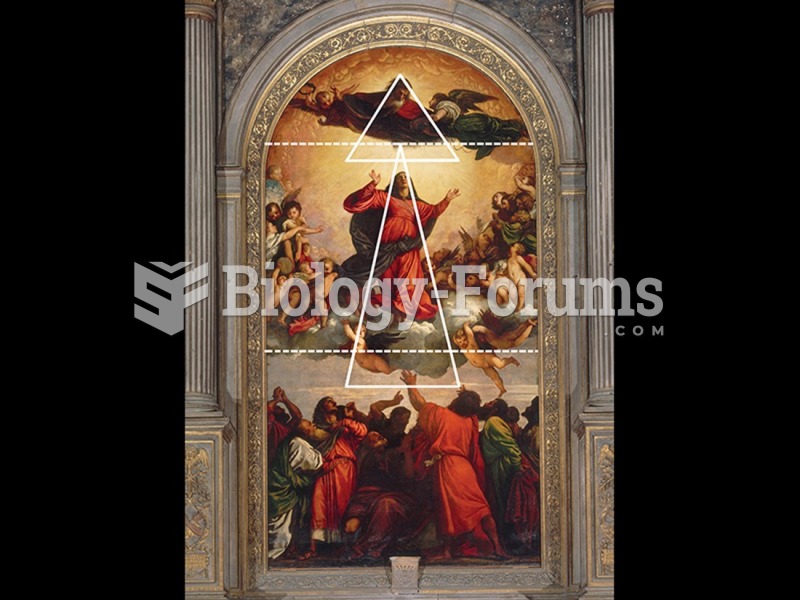 Line analysis of Titian, Assumption and Consecration of the Virgin.
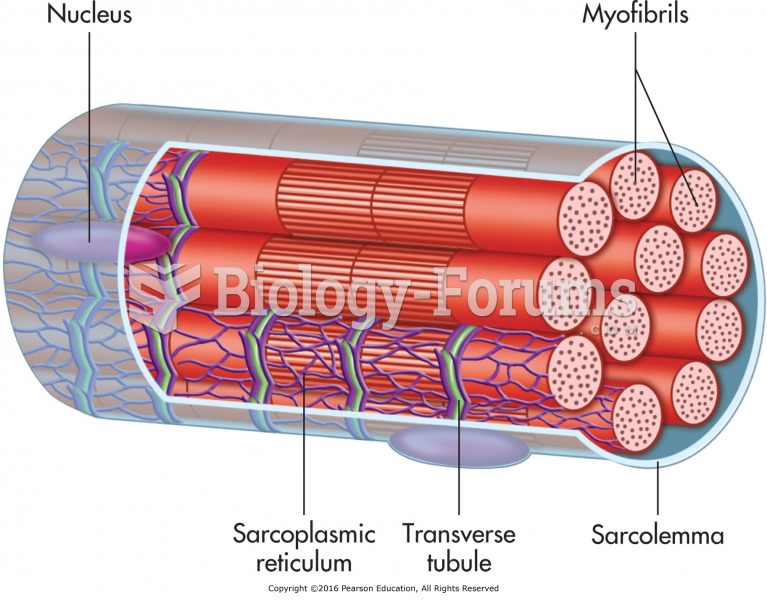 The distribution of the sarcoplasmic reticulum and tubules around myofibrils of skeletal muscle.
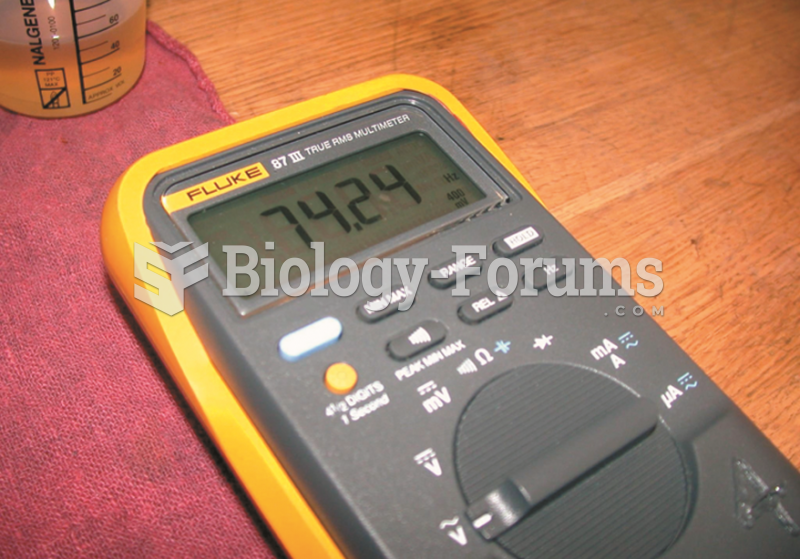 Adding additional amounts of ethyl alcohol (ethanol) increases the frequency reading.
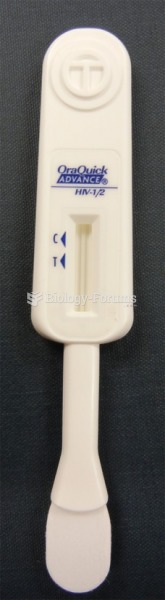 OraQuick. A negative result would show a red line at the "C" mark, whereas a positive ...
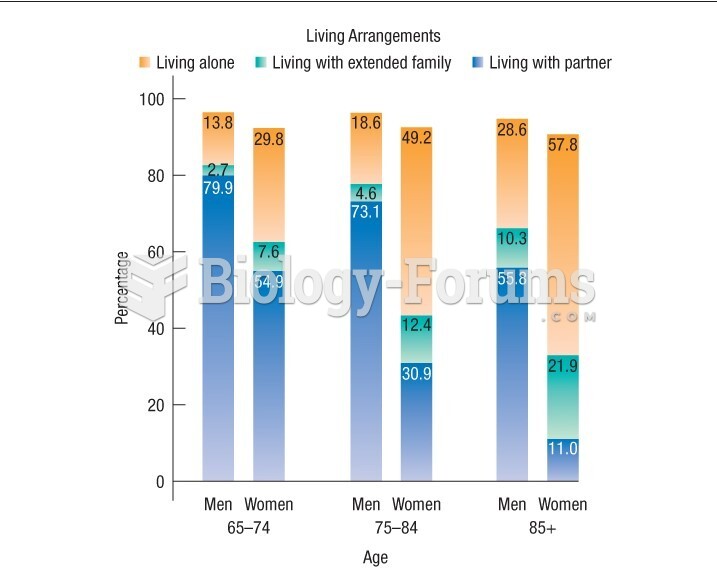 Graph shows the living arrangements of Canadian seniors
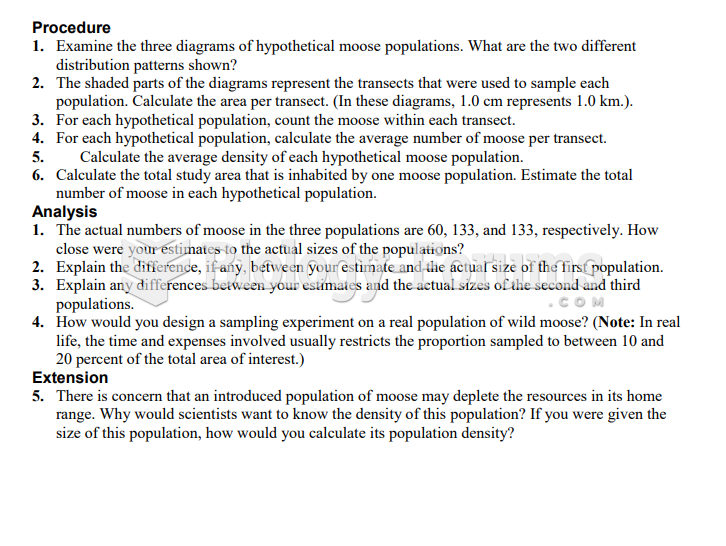 Distribution Patterns and Population Size Estimates (Bio 30)