This topic contains a solution. Click here to go to the answer
|
|
|

 Uranus's aurorae against its equatorial rings, imaged by the Hubble telescope. Unlike the auror
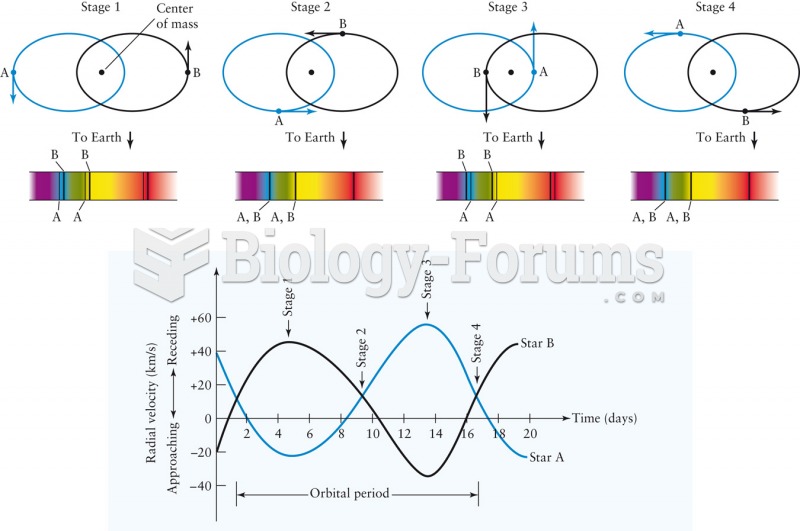 Spectral Line Motion in Binary Star Systems
 The b-galactosdase chart
 Three days after the Boston Marathon explosion, the FBI released this photograph that had been taken
 Find the equation of the normal line to f(x)=sinx+cosx at x = π.
 A truncated cell lineage chart for C. elegans