This topic contains a solution. Click here to go to the answer
|
|
|

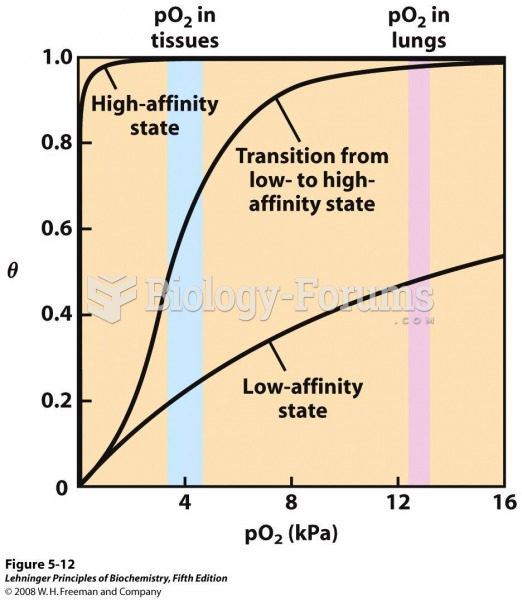 A sigmoid (cooperative) binding curve
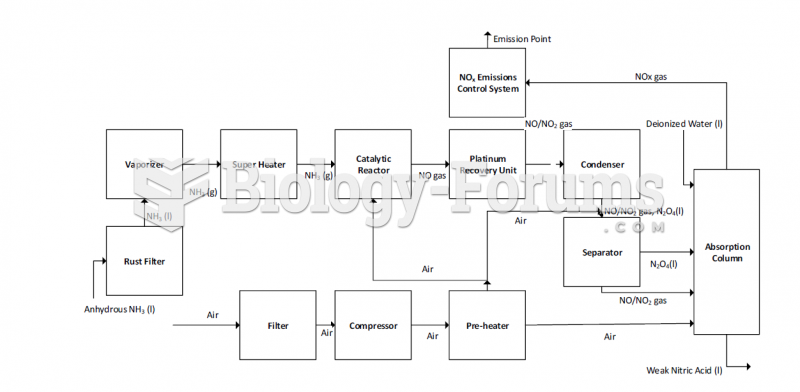 Block Diagram of a Dual-stage Pressure System for Dual-Stage Pressure Production of Nitric Acid Seme
 Figure-8s at the knuckles of the hand.
 Mobilize knuckles with figure-8s. Turn the hand so palm faces the table. Grasp the proximal phalange ...
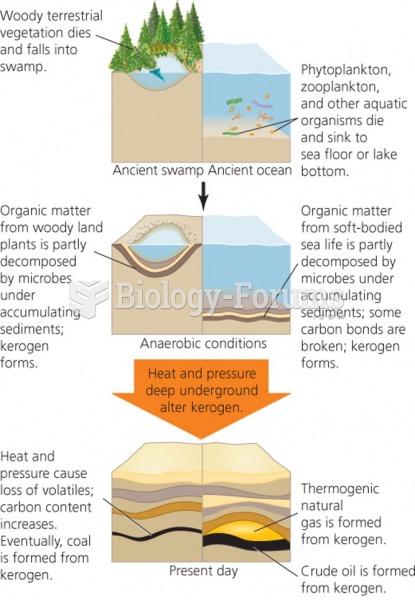 Fossil fuels production
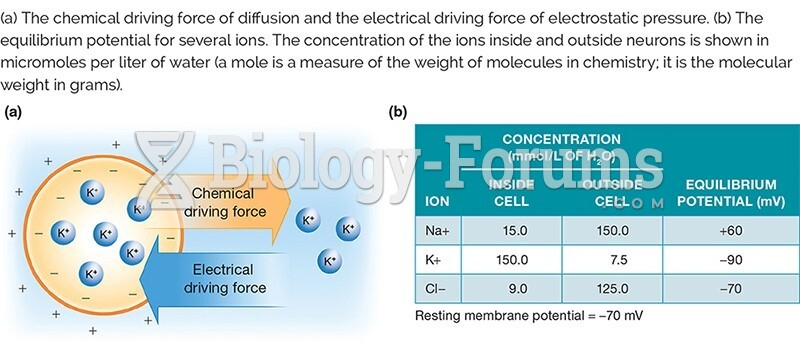 Figure 2.15.jpg