This topic contains a solution. Click here to go to the answer
|
|
|

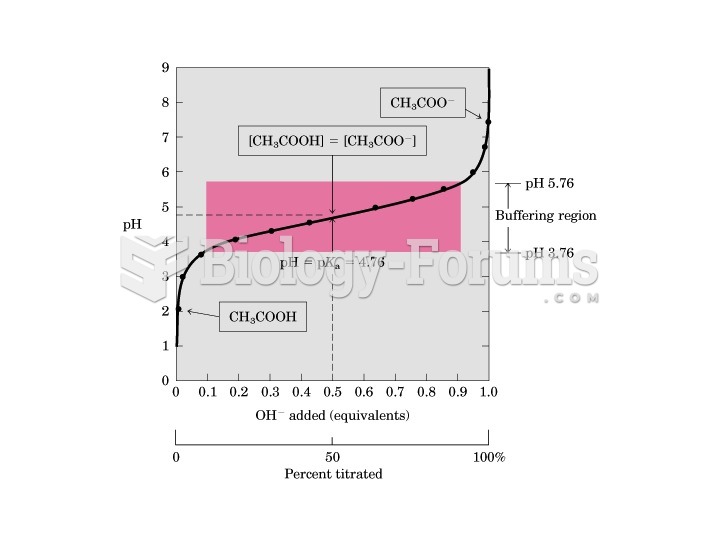 Titration Curve
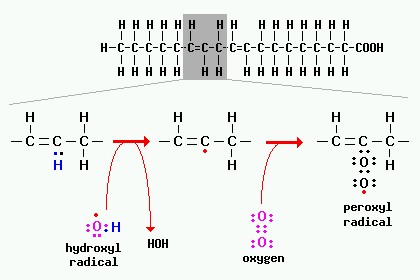 A peroxidation reaction involving a fatty acid is depicted in the figure below.
 New Yorkers flee from the dust caused by the collapse of the twin towers of the World Trade Center f
 Major U.S. Centers of Cattle, Corn, Wheat, and Soybean Production
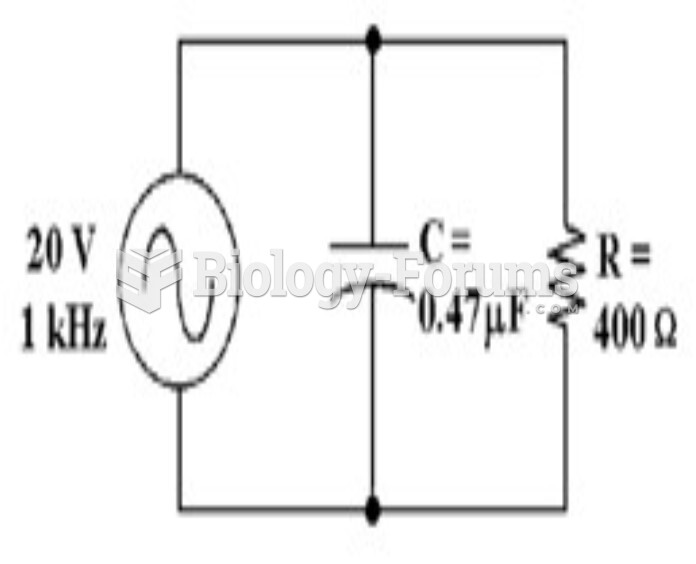 How much voltage does the resistor drop in Figure 10-2? a. 59 mV b. 19.94 V c. 20 V d. 10 V
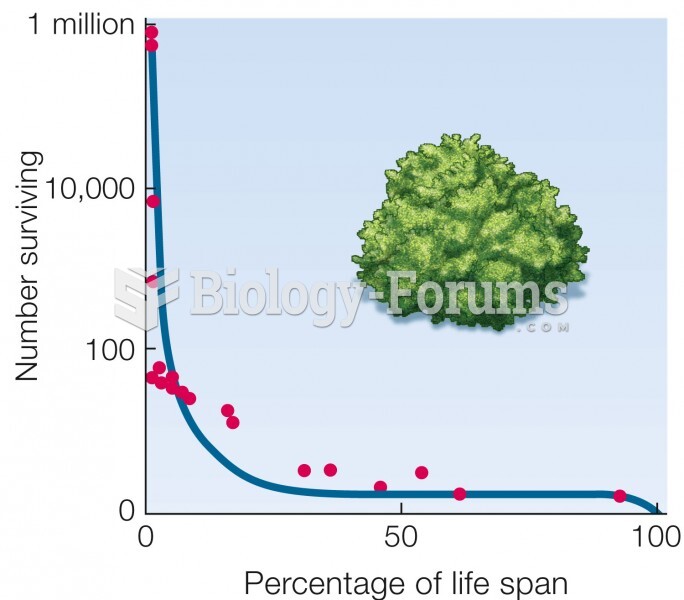 Type III curve. Mortality is highest early in life. Data for a desert shrub (Cleome droserifolia).