This topic contains a solution. Click here to go to the answer
|
|
|

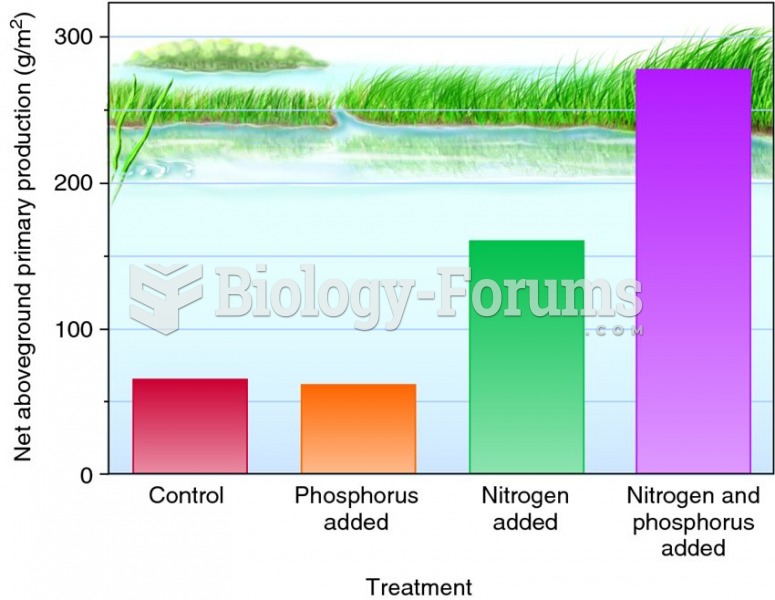 Primary production is constrained by the most limiting factor.
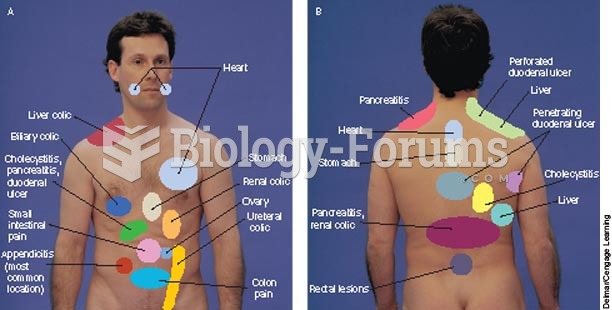 Areas of referred pain; A, anterior view; B, posterior view.
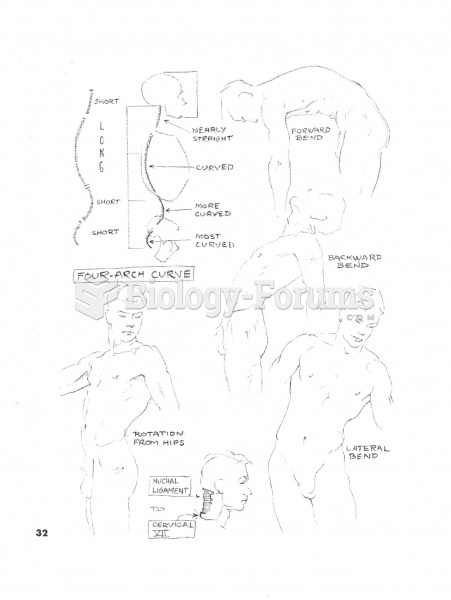 Four Arch Curve
 Re-creation of Pheidias’s Huge Gold and Ivory Figure of Athena
 Products like Beano contain enzymes that help reduce the production of gas in the large intestine
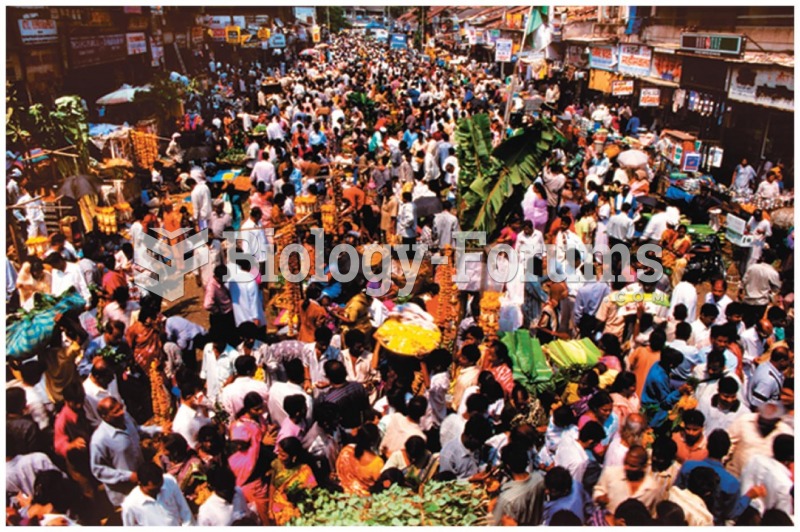 As the world’s population continues to grow, demands on limited resources for food production