Refer to Table 20-8. Suppose that the data in the table above reflect the price levels in the economy. What is the inflation rate in between 2015 and 2016?
A) 2 B) 5 C) 10 D) 12 E) 20
Question 2
The long-run aggregate supply curve shows the relationship between
A) short-run aggregate supply and short-run aggregate demand.
B) the quantity of real GDP supplied and the quantity of nominal GDP supplied.
C) the real interest rate and the nominal interest rate.
D) the price level and quantity of real GDP supplied.

 The mass media not only reflect gender stereotypes but they also play a role in changing them. ...
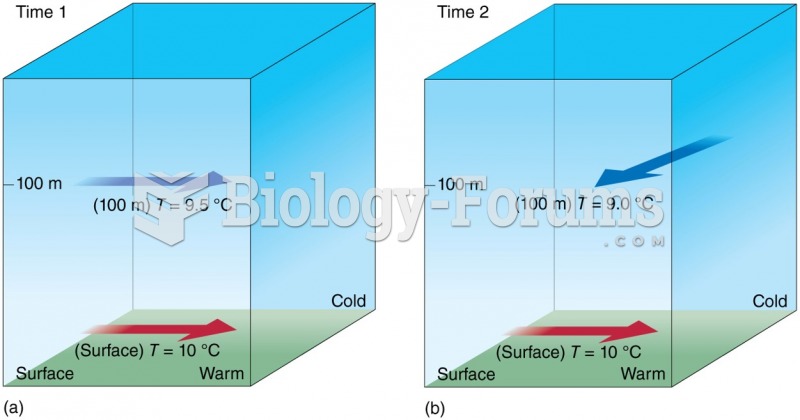 Advection of cold and warm air at different levels.
 Standing at the head of the table, apply oil or lotion to the entire back with bilateral stroking. ...
 Data management questions
 levels of organizations
 Relative levels of neuronal loss in HD transgenic mice