Refer to Table 20-8. Suppose that the data in the table above reflect the price levels in the economy. What is the inflation rate in between 2015 and 2016?
A) 2 B) 5 C) 10 D) 12 E) 20
Question 2
The long-run aggregate supply curve shows the relationship between
A) short-run aggregate supply and short-run aggregate demand.
B) the quantity of real GDP supplied and the quantity of nominal GDP supplied.
C) the real interest rate and the nominal interest rate.
D) the price level and quantity of real GDP supplied.

 Changes in boreal forest composition along a chronosequence in Quebec. Dates refer to the year of th
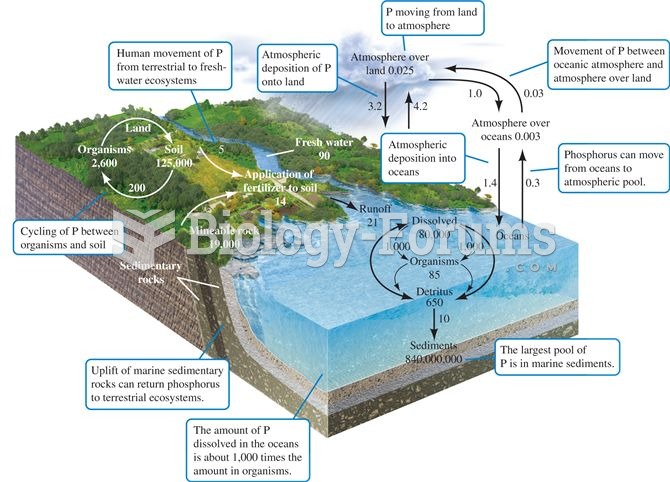 The phosphorus cycle. Numbers are 1012 g P or fluxes as 1012 g P per year (data from Schlesinger 199
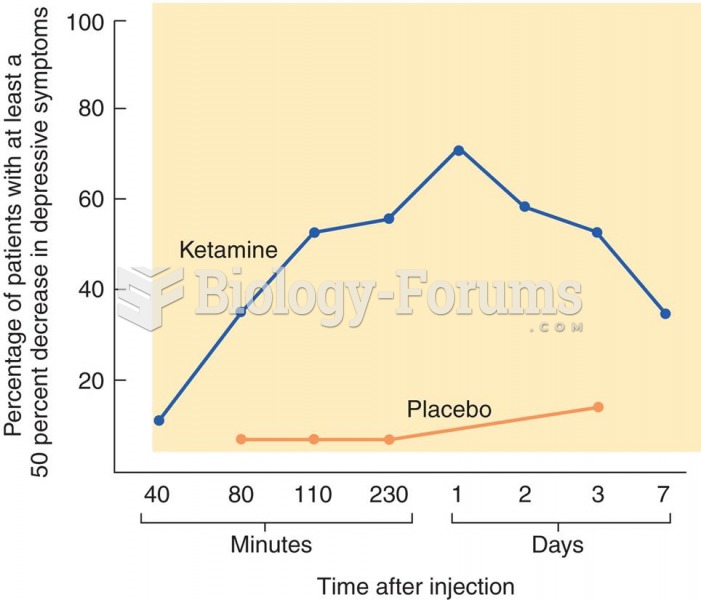 Treatment of Depression with Ketamine The graph shows the effects of ketamine on symptoms of depress
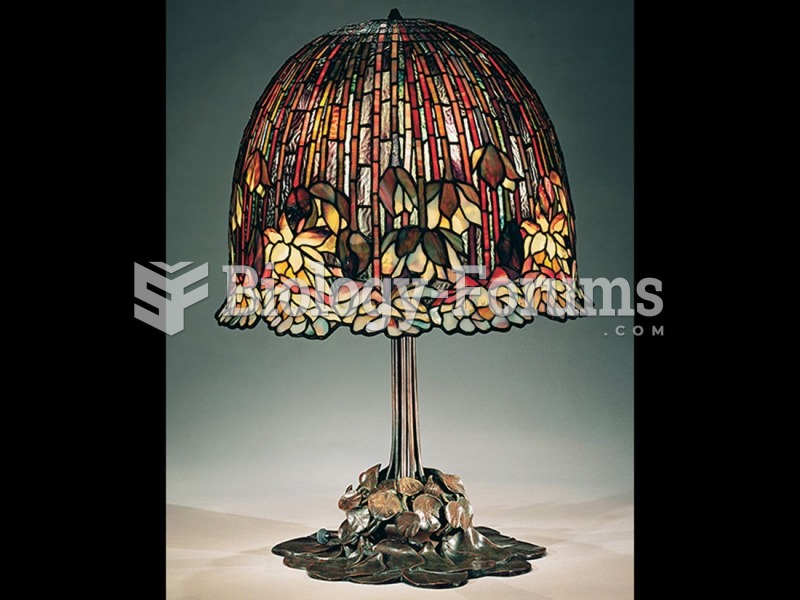 Louis Comfort Tiffany, Tiffany Studios, Water-lily table lamp.
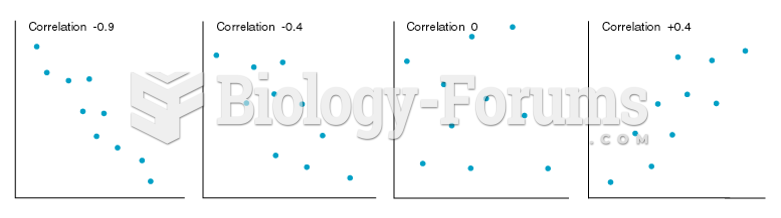 Scatterplots of Variables Having Several Different Levels of Correlation
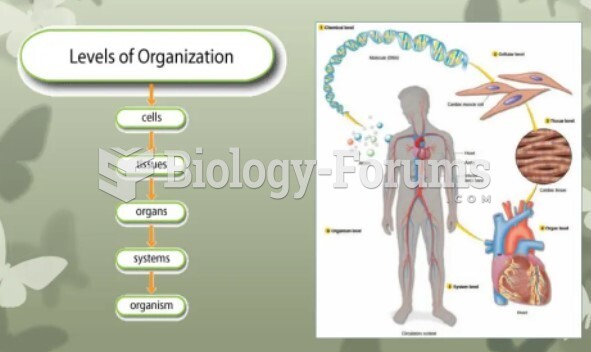 levels of organizations