Refer to Table 20-8. Suppose that the data in the table above reflect the price levels in the economy. What is the inflation rate in between 2015 and 2016?
A) 2 B) 5 C) 10 D) 12 E) 20
Question 2
The long-run aggregate supply curve shows the relationship between
A) short-run aggregate supply and short-run aggregate demand.
B) the quantity of real GDP supplied and the quantity of nominal GDP supplied.
C) the real interest rate and the nominal interest rate.
D) the price level and quantity of real GDP supplied.

 How to create a price index to calculate inflation for a basket of goods
 Redrape the back, face the head of the table, and apply passive touch as finishing technique. Gently ...
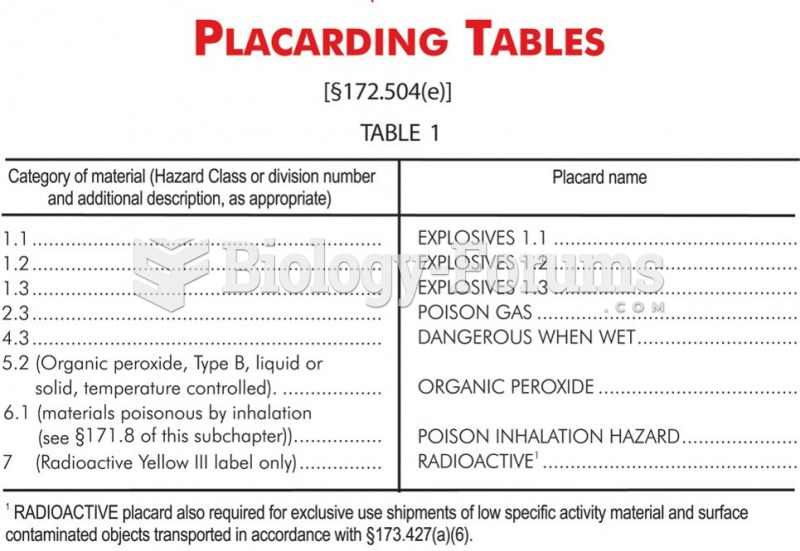 DOT placarding requirements: Table 1 materials must be placarded in any quantity, and Table 2 ...
 Almonds contain high levels of healthy unsaturated fatty acids
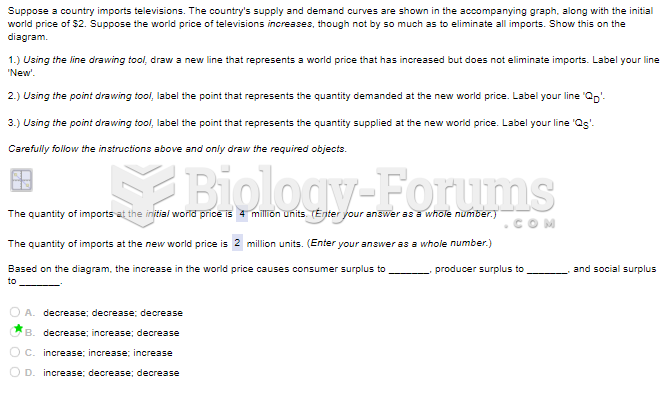 Suppose a country imports televisions. The country's supply and demand curves are shown in ...
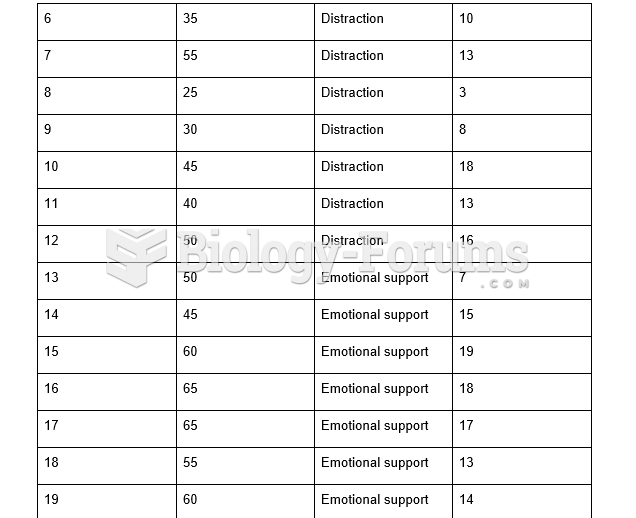 Table - Correlation Analysis