If you were looking at a scatter plot generated by SPSS that had small numbers instead of dots, your should assume that the numbers represent _____.
a. footnotes that indicate who the subjects were who generated each data point
b. the level of significance for each pair of measurements
c. the number of cases with the same measurements
d. footnotes that explain the various measurement procedures
Question 2
It is legitimate to do ratios with interval scaling.
Indicate whether the statement is true or false

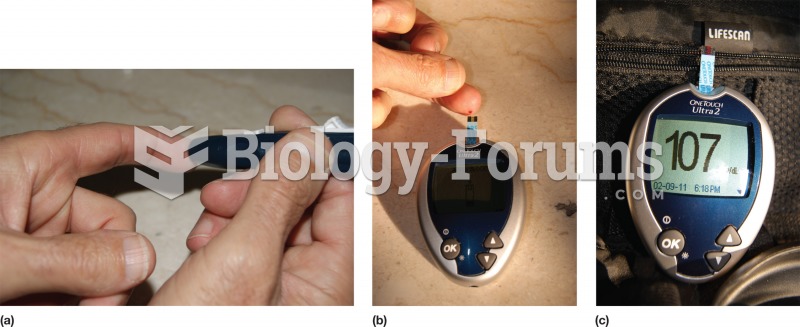 Blood glucose measurement. A postprandial test may be self-administered. (a) A lance pierces the ski
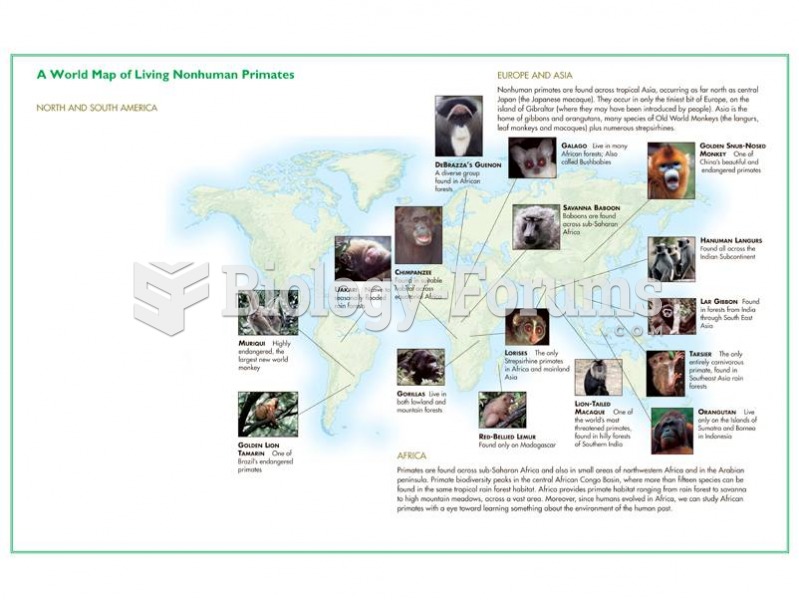 Primates in the New World tend to be small-bodied compared to those elsewhere.
 Memory saver. The part numbers represent components from Radio Shack®.
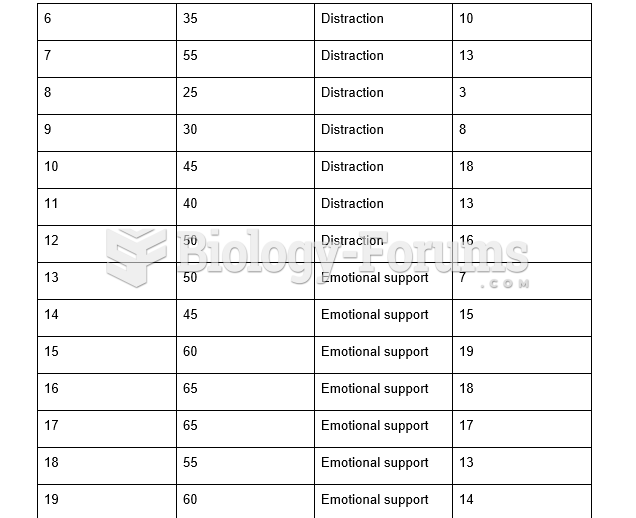
 Identification of the numbers in the Word Problem
 APA Table - SPSS
 Gene-expression analysis generated from expression DNA microarrays