If you were looking at a scatter plot generated by SPSS that had small numbers instead of dots, your should assume that the numbers represent _____.
a. footnotes that indicate who the subjects were who generated each data point
b. the level of significance for each pair of measurements
c. the number of cases with the same measurements
d. footnotes that explain the various measurement procedures
Question 2
It is legitimate to do ratios with interval scaling.
Indicate whether the statement is true or false

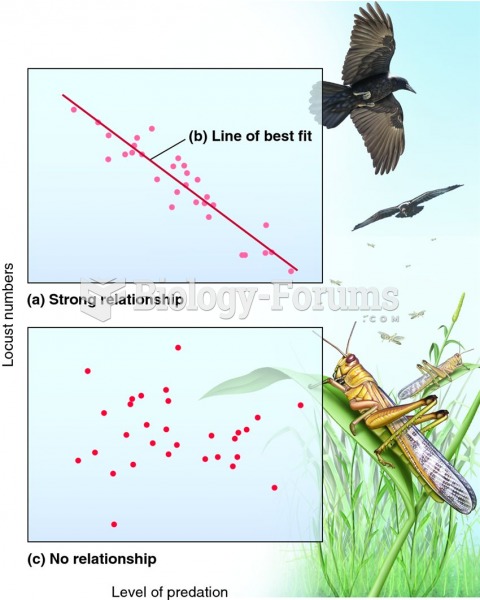 How locust numbers might be correlated with predation.
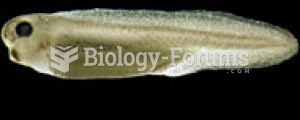 The Xenopus frog tadpole is a small, simple vertebrate.
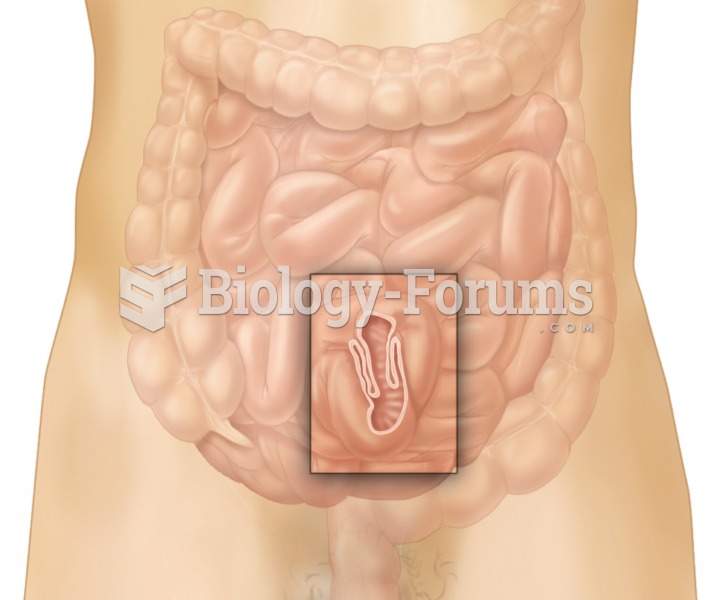 Intussusception. A short length of small intestine has telescoped into itself.
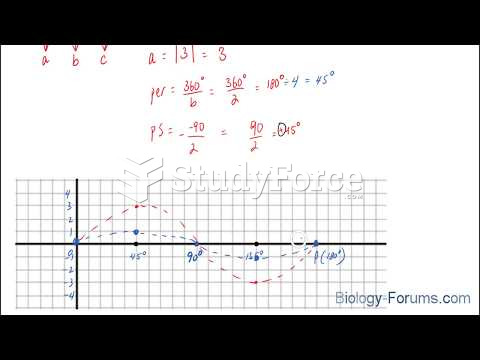 How to plot a sine function containing an amplitude and phase shift (Question 1 of 3)
 Pulling a skewer through chocolate and raspberry-sauce dots to create a border of hearts
 How to analyse a pathological stage plot?