If you were looking at a scatter plot generated by SPSS that had small numbers instead of dots, your should assume that the numbers represent _____.
a. footnotes that indicate who the subjects were who generated each data point
b. the level of significance for each pair of measurements
c. the number of cases with the same measurements
d. footnotes that explain the various measurement procedures
Question 2
It is legitimate to do ratios with interval scaling.
Indicate whether the statement is true or false

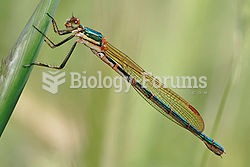 Lestidae is a rather small family of cosmopolitan, large-sized, slender damselflies. They are of the
 The common squirrel monkey (Saimiri sciureus) is a small New World primate from the Cebidae (squirre
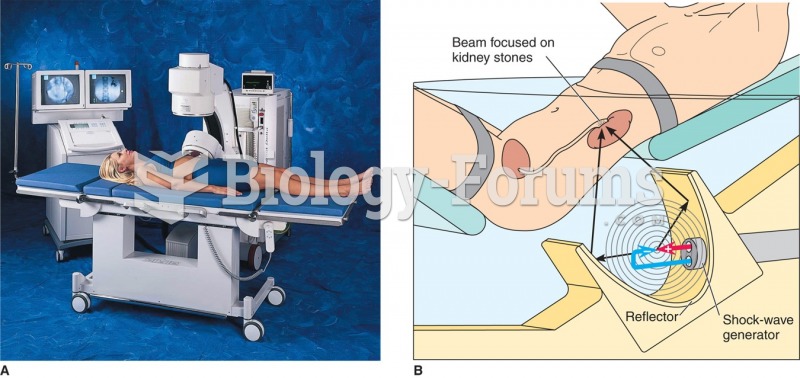 Extracorporeal shock-wave lithotripsy. Acoustic shock waves generated by the shock-wave generator ...
 Entrepreneurship: Starting and Operating a Small Business (3rd Edition)
 Small Intestine (SI)
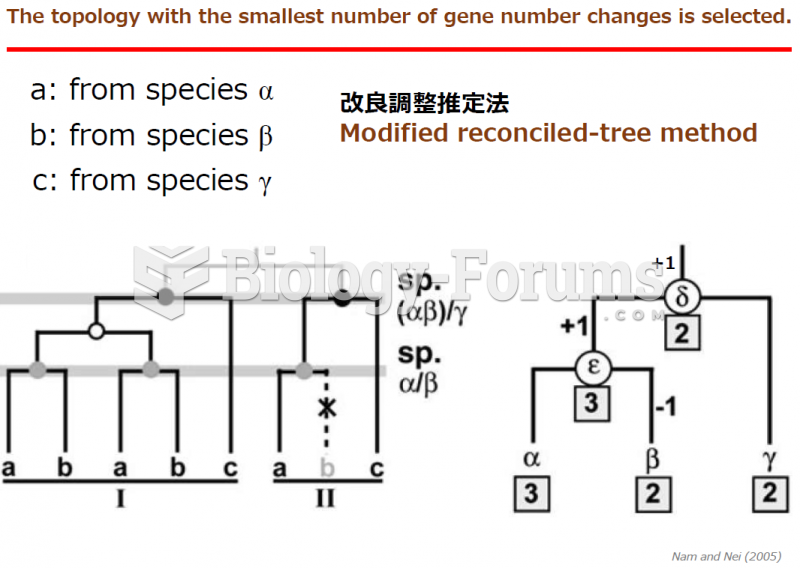 How to calculate the gain and loss gene numbers with low bootstrap of phylogenetic tree?