Refer to Figure 4-2. What area represents the decrease in producer surplus when the market price falls from P2 to P1?
A) B + D B) A + B C) C + E D) A + C + E
Question 2
Refer to Figure 5-1. Suppose the current market equilibrium output of Q1 is not the economically efficient output because of an externality. The economically efficient output is Q2. In that case, the diagram shows
A) the effect of an external cost imposed on a producer.
B) the effect of a positive externality in the production of a good.
C) the effect of a negative externality in the production of a good.
D) the effect of an external benefit such as a subsidy granted to consumers of a good.

 Area of Manatee Population
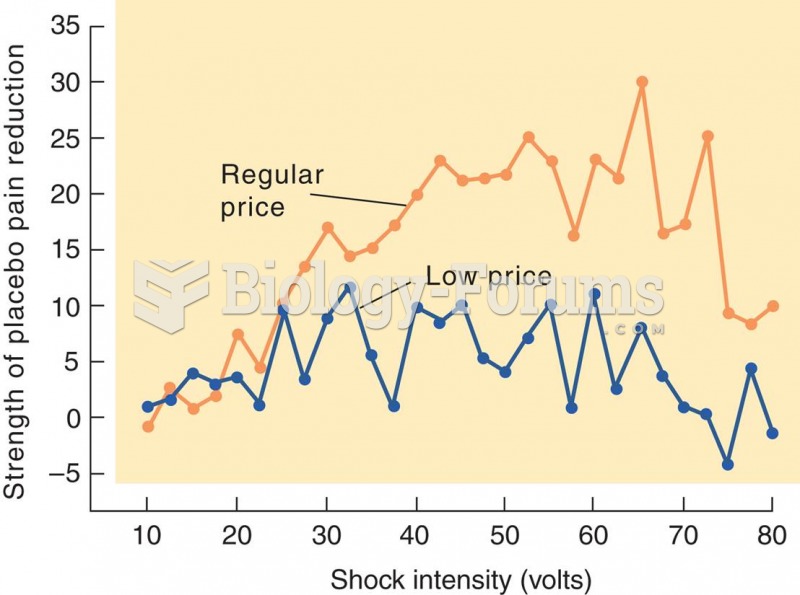 Effect of Perceived Price of a Drug on Placebo Analgesia
 Historian James Merrell notes several errors in Benjamin West’s famous 1771 painting, William Penn’s
 Basic sliding effleurage using the forearm applies broad, deep pressure to an area.
 Clear the inguinal catchment area. Face the side of the table at recipient’s waist. Place your ...
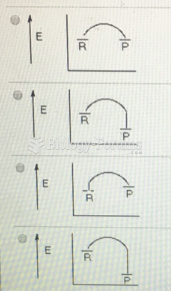 Which of the following represents a reaction coordinate diagram for a chemical reaction whose ...