Refer to Figure 4-2. What area represents the decrease in producer surplus when the market price falls from P2 to P1?
A) B + D B) A + B C) C + E D) A + C + E
Question 2
Refer to Figure 5-1. Suppose the current market equilibrium output of Q1 is not the economically efficient output because of an externality. The economically efficient output is Q2. In that case, the diagram shows
A) the effect of an external cost imposed on a producer.
B) the effect of a positive externality in the production of a good.
C) the effect of a negative externality in the production of a good.
D) the effect of an external benefit such as a subsidy granted to consumers of a good.

 Female cheetah and cubs in the Ngorongoro Conservation Area
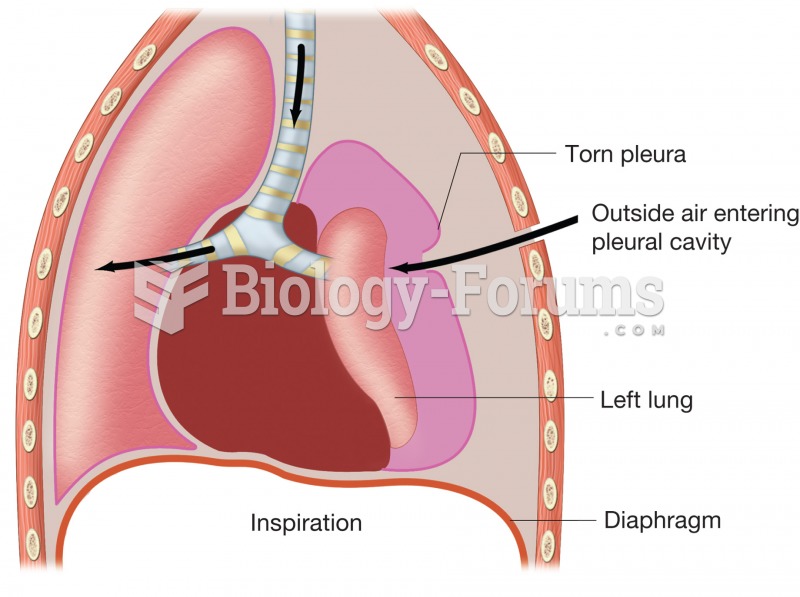 Pneumothorax. Figure illustrates how puncture of thoracic wall and tearing of pleural membrane allow
 A typical reception area in a medical office.
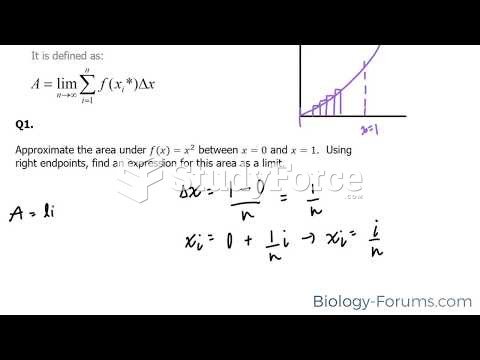 How to use right endpoints to find an expression showing the area of a function
 Excessive video gaming decrease social and physical development in a child
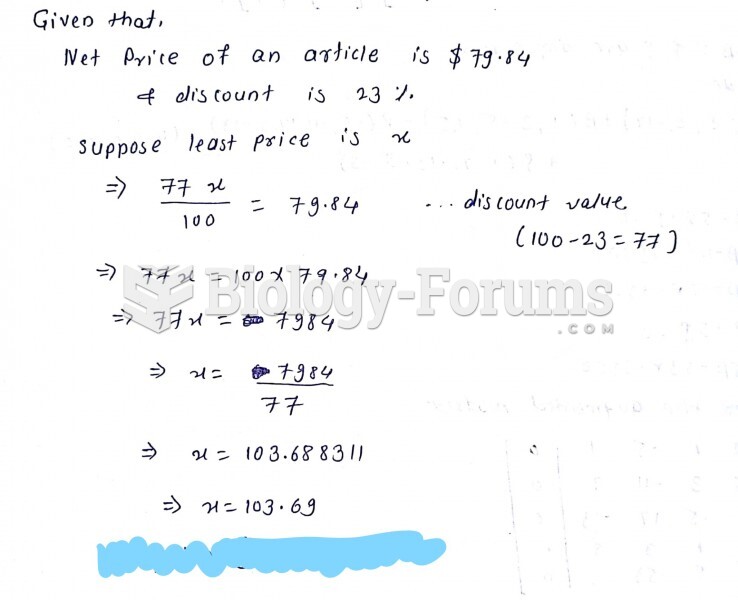 The net price of an article is $79.84. What is the list price if a discount of 23% was allowed?