How can the influence of a third variable be shown on a two-dimensional graph?
A) by allowing the position of the relationship line or curve to shift on the graph
B) by super-imposing the third variable on the two-dimensional graph
C) by drawing a third axis coming out of the two axes
D) by allowing the relationship to be nonlinear
Question 2
With the exception of during recessions, workers in Canada are eligible for unemployment benefits for about twice as long a period of time as workers in the United States. As a result,
A) frictional unemployment is higher, on average, in the United States than in Canada.
B) the opportunity cost of job search in Canada is lower than in the United States.
C) the average duration of unemployment is longer in the United States than in Canada.
D) the unemployment rate in Canada is usually higher than in the United States.

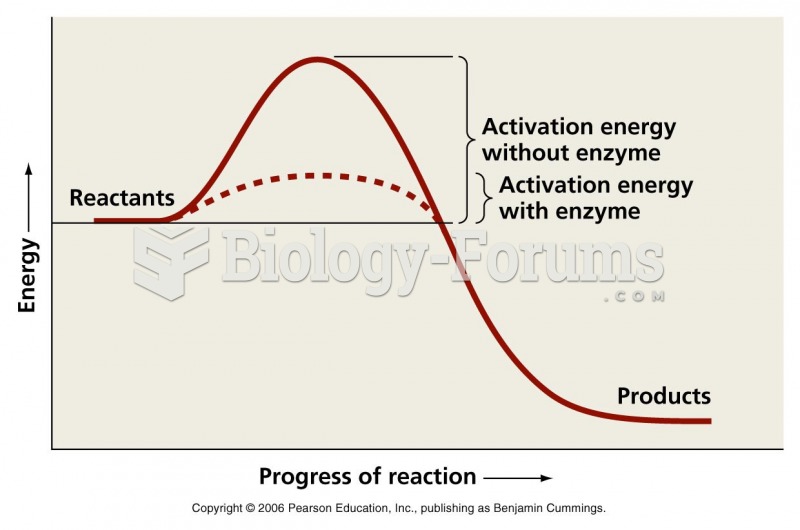 Activation energy graph
 This depiction breaks stereotypes, but is historically accurate. Shown here is an Iroquois fort. Can ...
 Sketch the graph of each function using transformations. State the domain and range.
 Sketch the graph using the tables providing. Determine if each function is continuous or ...
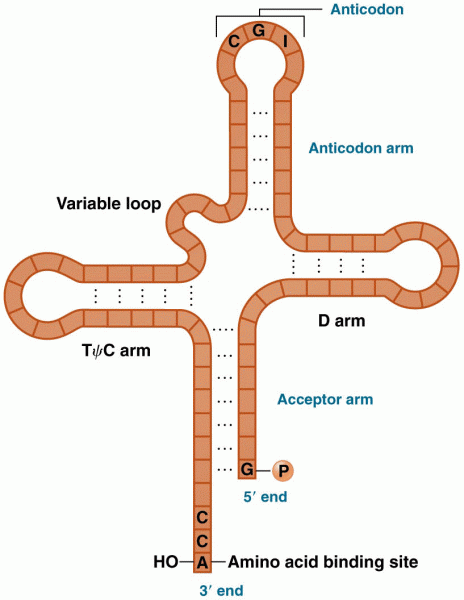 Holley’s two-dimensional cloverleaf model of transfer RNA
 Rosalind Franklin, shown here on holiday, used X-ray diffraction to investigate the structure of DNA