|
|
|

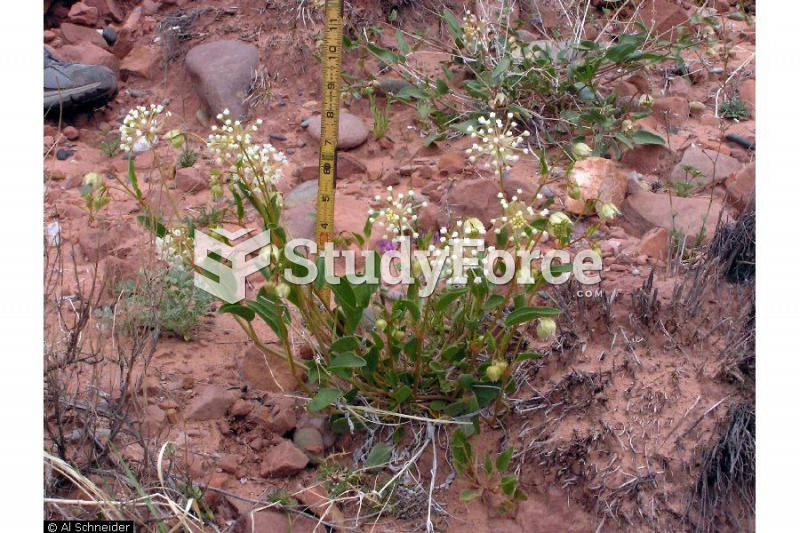 Plant
Plant
 Plant
Plant
 Plant
Plant
 Native American casinos remain a topic of both controversy and envy. Shown here is Corey Two Crow as ...
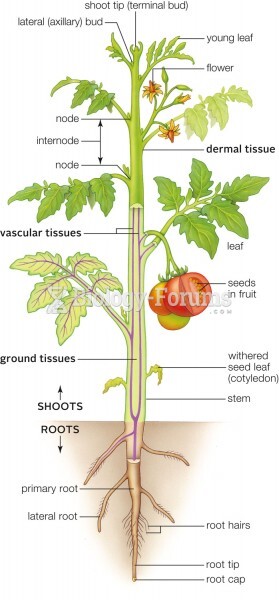 Body plan of a tomato plant
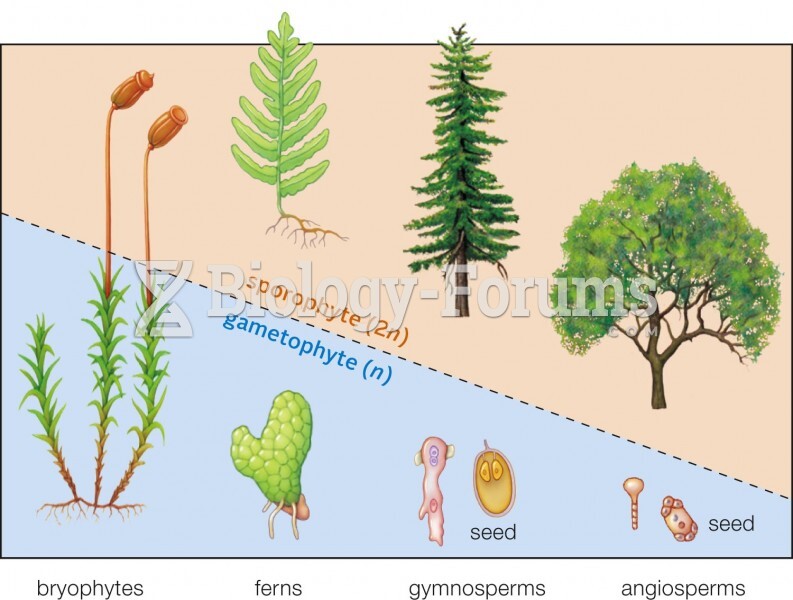 Evolutionary trend in plant life cycles
|
|
|
Plant
Plant
Plant
Native American casinos remain a topic of both controversy and envy. Shown here is Corey Two Crow as ...
Body plan of a tomato plant
Evolutionary trend in plant life cycles
For a complete list of videos, visit our video library