|
|
|

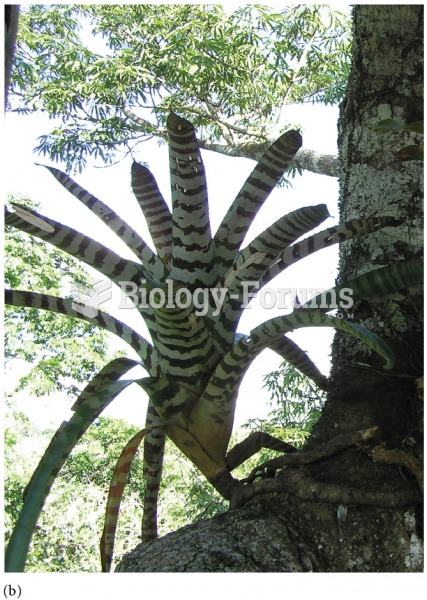 (b) A epiphytic plant growing on the branch of a tree.
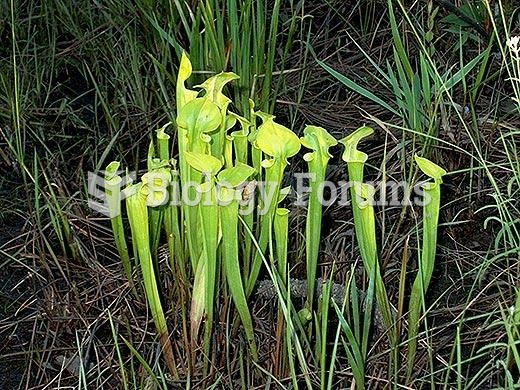 Yellow pitcher plant (Sarracenia flava)
 Plant
Plant
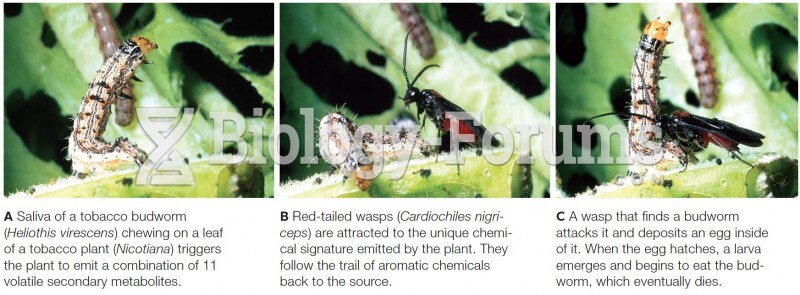 Interspecific Plant Defenses
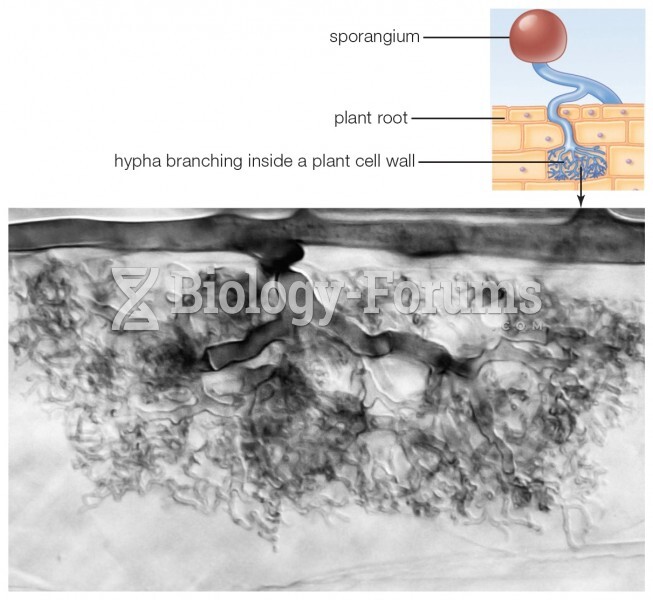 Glomeromycete hypha branching inside the cell of a plant root.
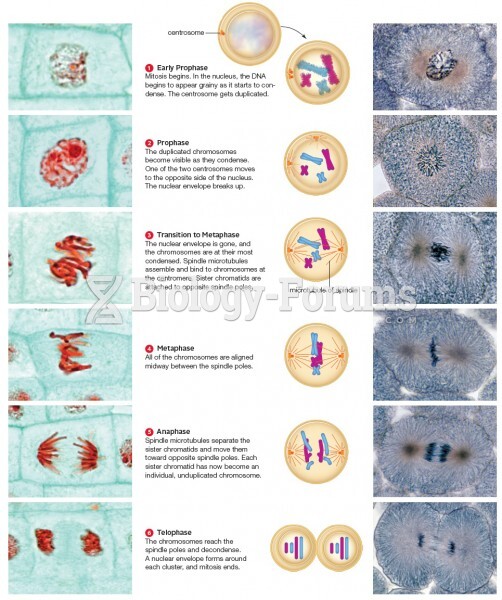 Mitosis (A comparison of plant vs. animal cells)