|
|
|

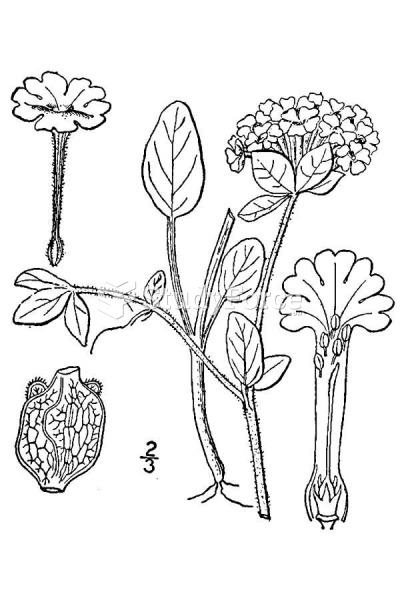 Plant
Plant
 Plant
Plant
 Plant
Plant
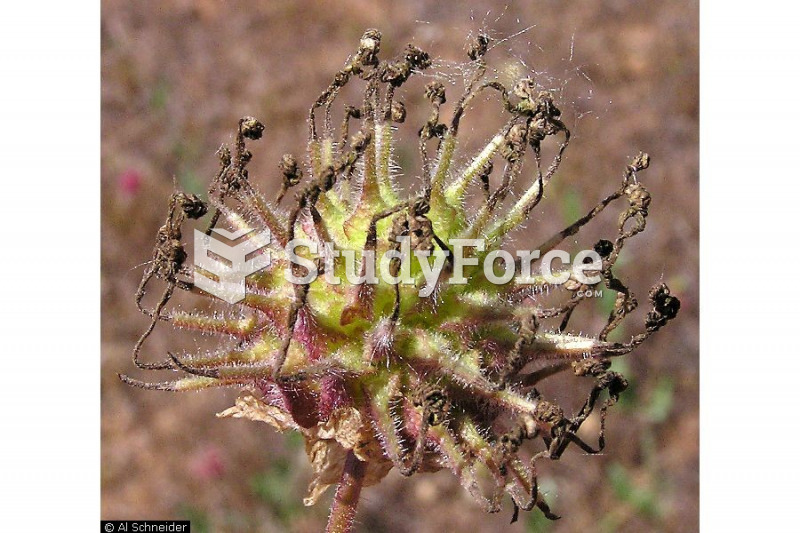
 plant
plant
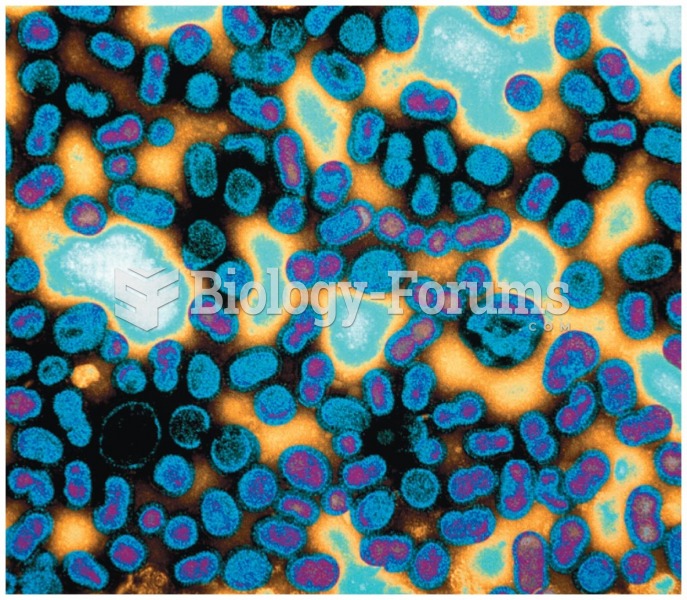 Viruses, such as the hepatitis B virus shown here, need a host to survive and multiply
 The total weight of Peter, David and Henry is 123 kg, Peter is 15 kg heavier than David. David ...