|
|
|

 An electrocardiogram (ECG, EKG) is a commonly used procedure in which the electrical events associat
 The frontal lobe (green) bounded by the Sylvian fissure (yellow line) and central sulcus (red line),
 Although the Democrats and the Republicans represent slightly different slices of the center, those ...
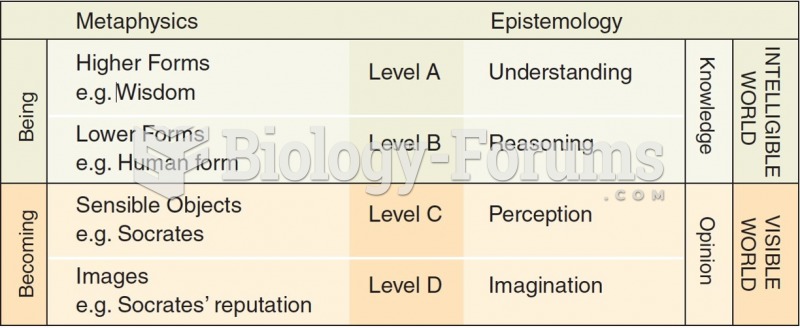 Plato’s Divided Line
 Two radio antennas are 130 m apart on a north-south line. The two antennas radiate in phase at ...
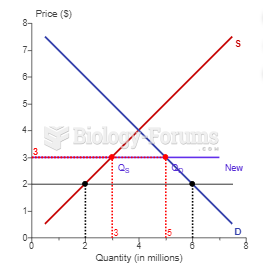 Suppose a country imports televisions. The country's supply and demand curves are shown in ...