|
|
|

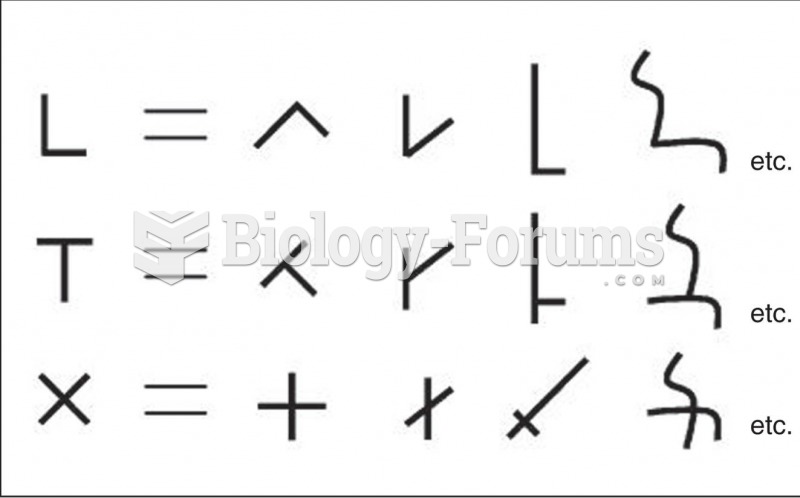 Examples of Ways That Different Types of Intersections of Two Line Segments Can Be Transformed into
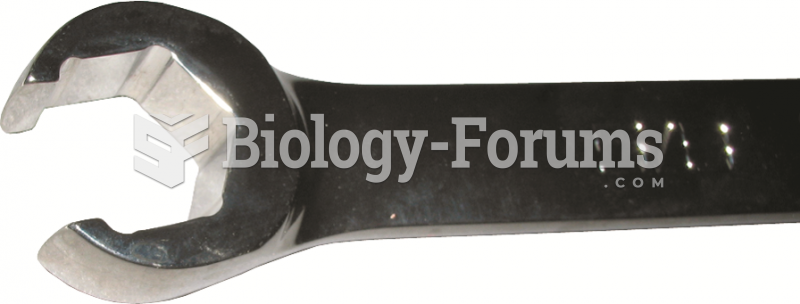 The end of a typical line wrench, which shows that it is capable of grasping most of the head of ...
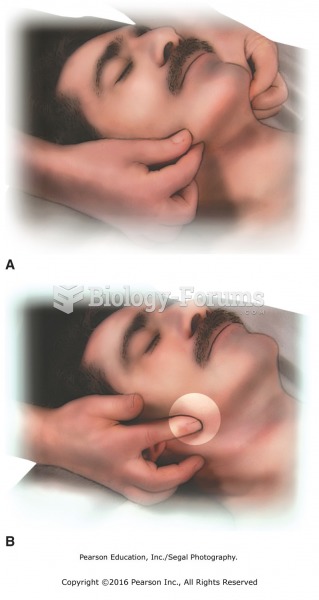 (A) Pinch along jaw line from midline to lateral aspect. (B) Press St-6 at masseter attachment.
 Sketch a graph of the function h(x), by hand on the following interval:
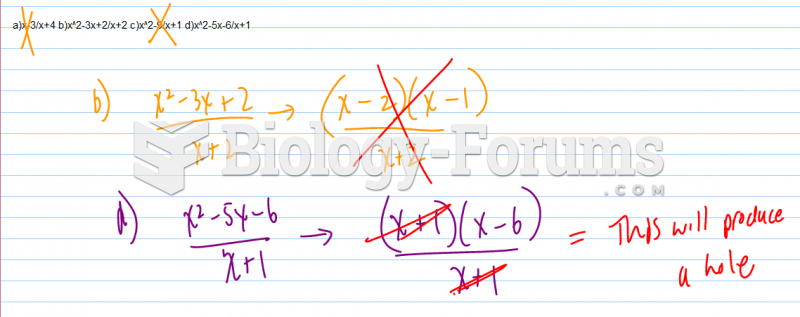 As a result of a hole in the graph, which of the following functions does not have an average ...
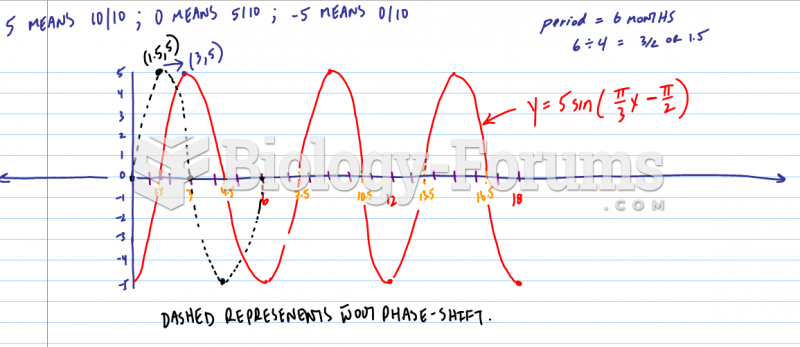
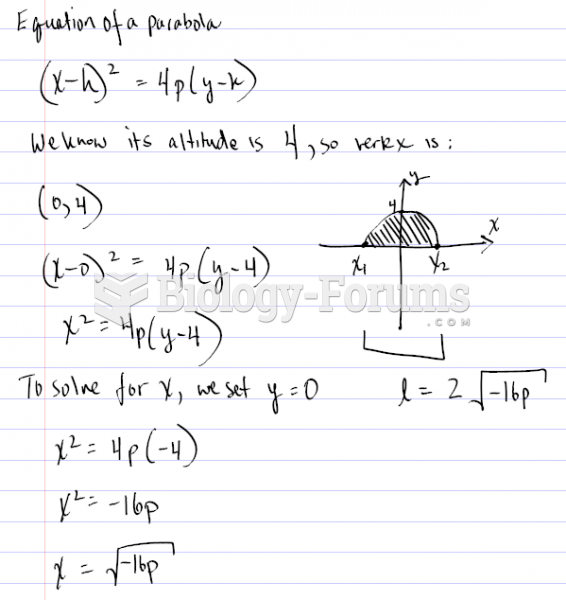 Finding the graph of a Parabola using certain values