|
|
|

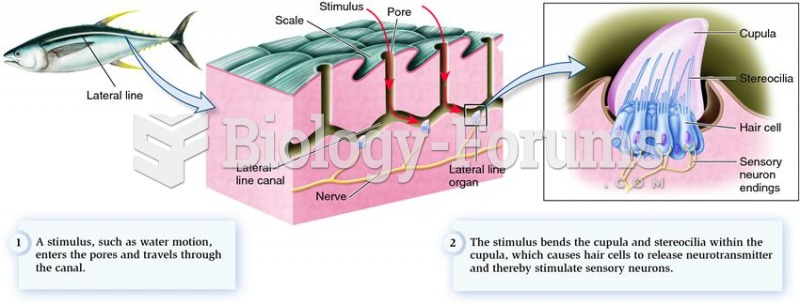 Mechanoreceptors in the lateral line system that detect changes in water movement.
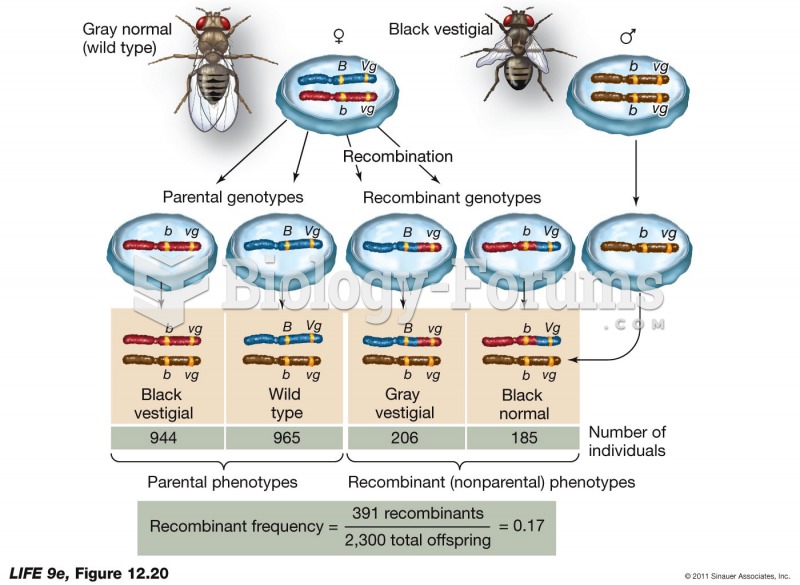 Recombinant Frequencies
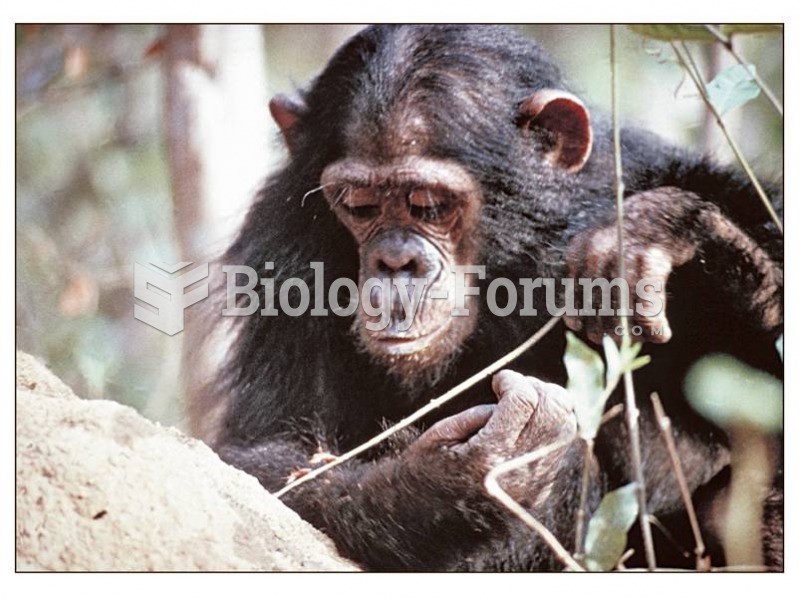 Wild chimpanzees make and use simple tools to obtain food, learning tool making from one another.
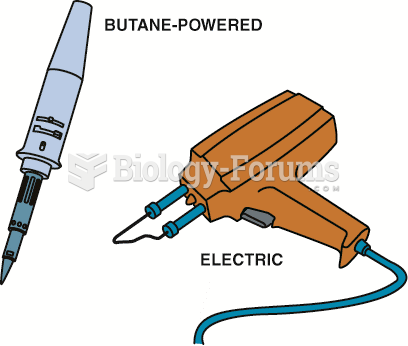 Electric and butane-powered soldering guns used to make electrical repairs. Soldering guns are sold ...
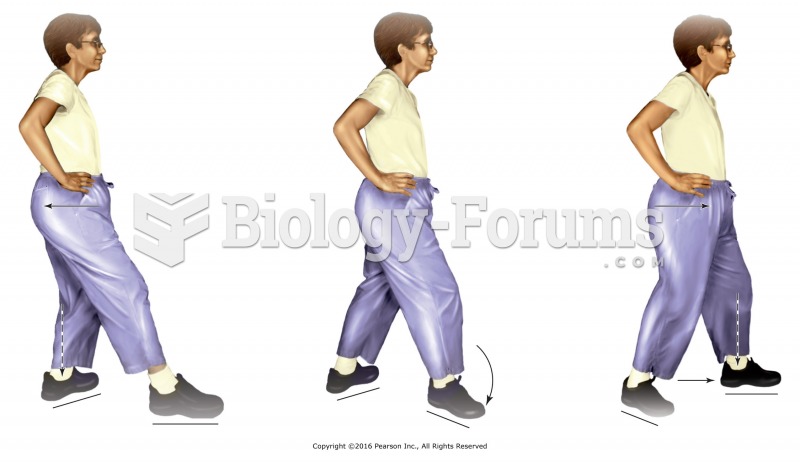 Tai chi walk along straight line. From tai chi stance, shift weight to the back leg and turn the ...
 Graph Liters per Hour