|
|
|

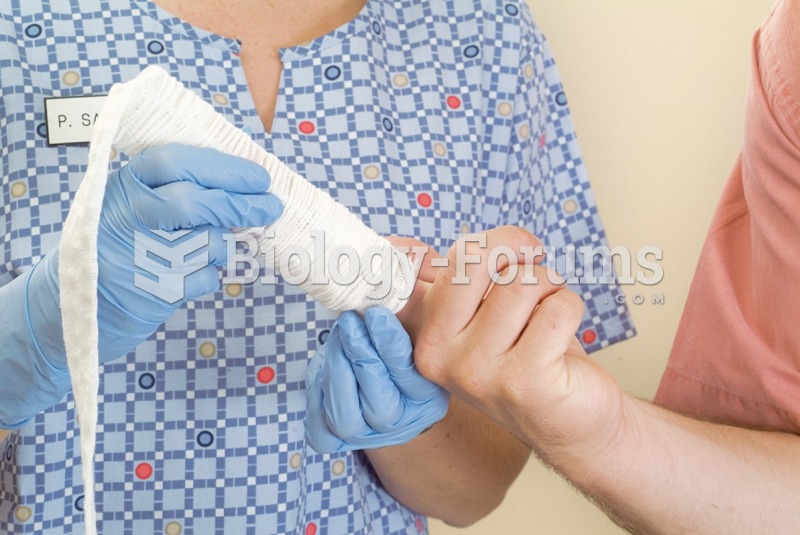 Demonstrate the Application of Triangular, Figure-Eight, and Tubular Bandages
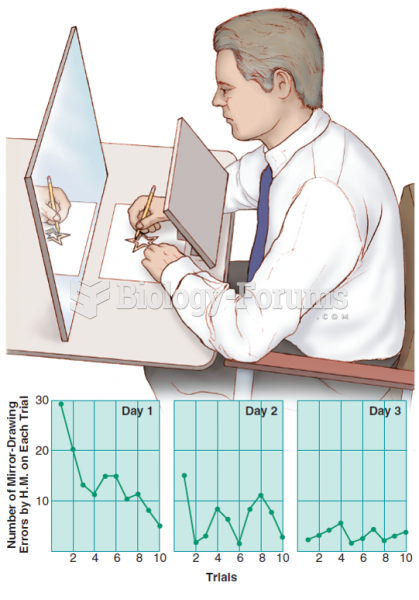 The learning and retention of the mirrordrawing task by H.M. Despite his good retention of the task, ...
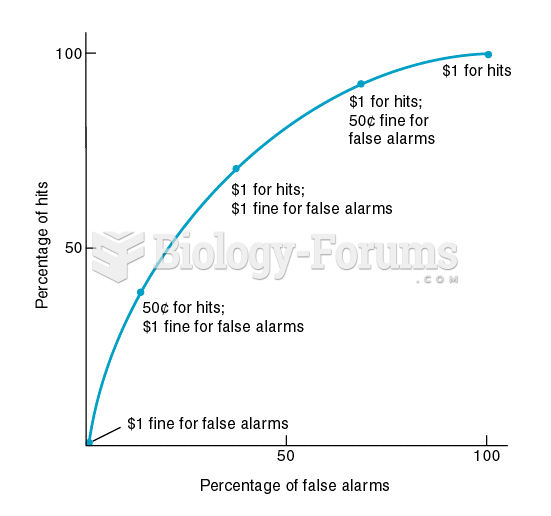 A Receiver-Operating-Characteristic (ROC) Curve
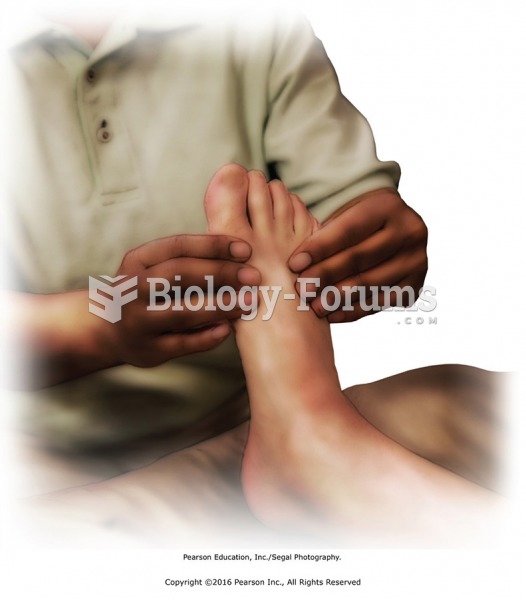 Mobilize joints of the feet and ankle. Apply scissoring to metatarsals and figure-8s to toes. Dorsi- ...
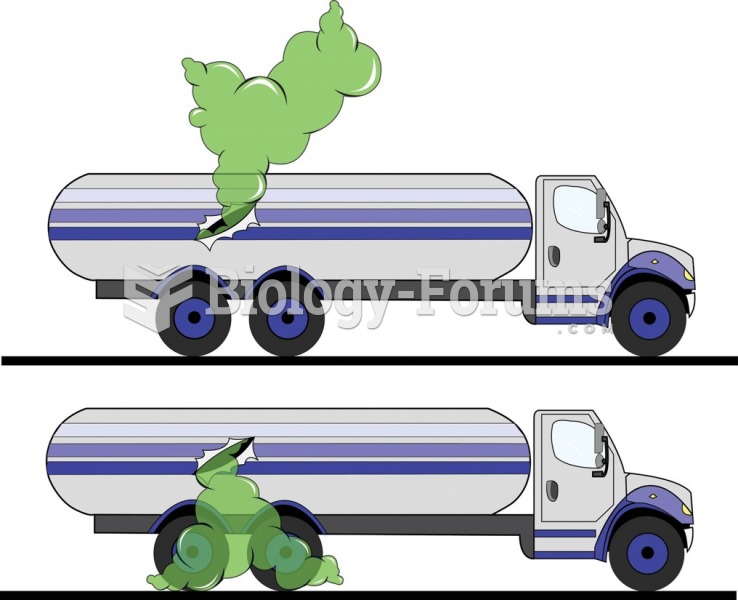 Vapor density. The top drawing illustrates the movement of a gas with a vapor density less than 1; ...
 Bayesian Analysis of the Genotype of II-2 in Figure A.4