|
|
|

 Mobilize hand and wrist joints. Apply scissoring to knuckles and figure-8s to fingers. Holding the ...
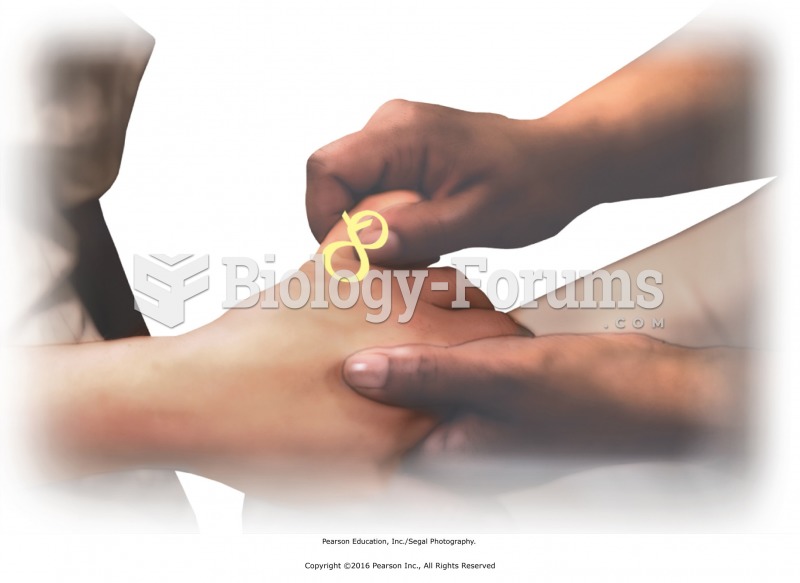 Joint movement of the fingers. Apply scissoring at the knuckles and figure-8s to the fingers to ...
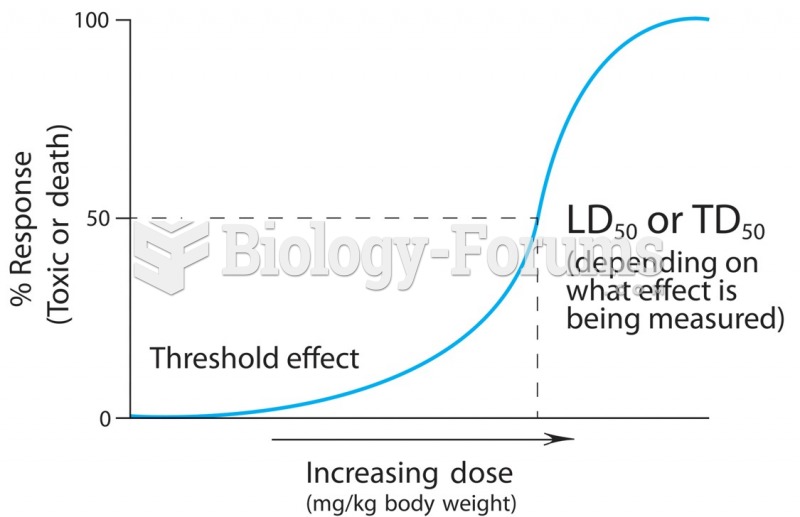 A dose-response curve describes the relationship between the quantity of the chemical entering the ...
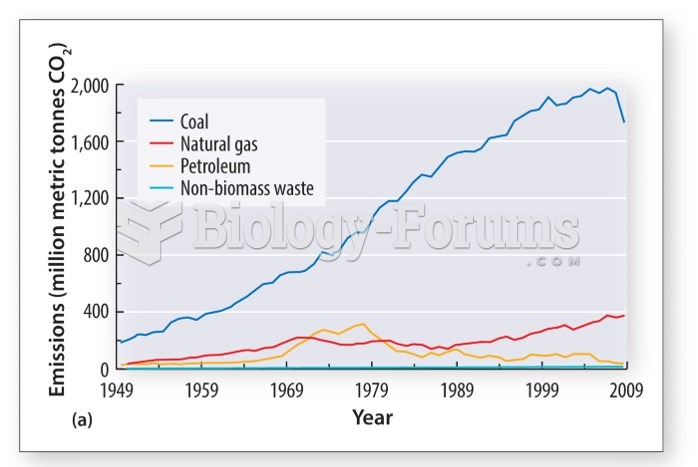 The demand for cheap coal to generate electrical power is rising
 Figure and Ground
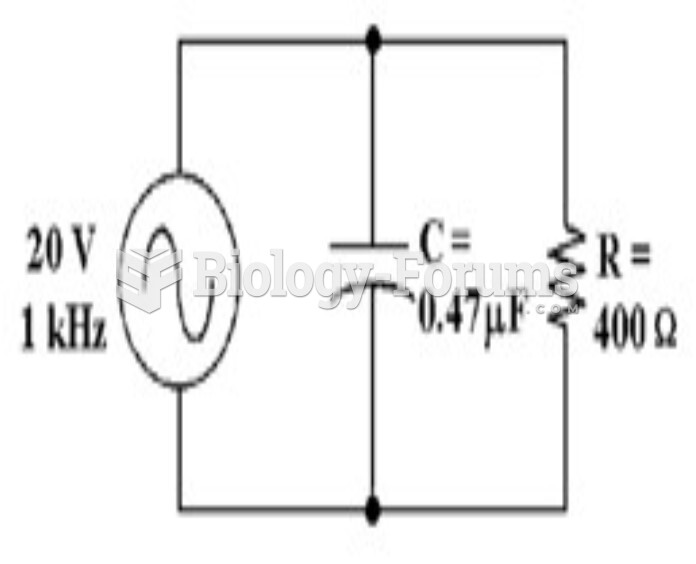 How much voltage does the resistor drop in Figure 10-2? a. 59 mV b. 19.94 V c. 20 V d. 10 V