|
|
|

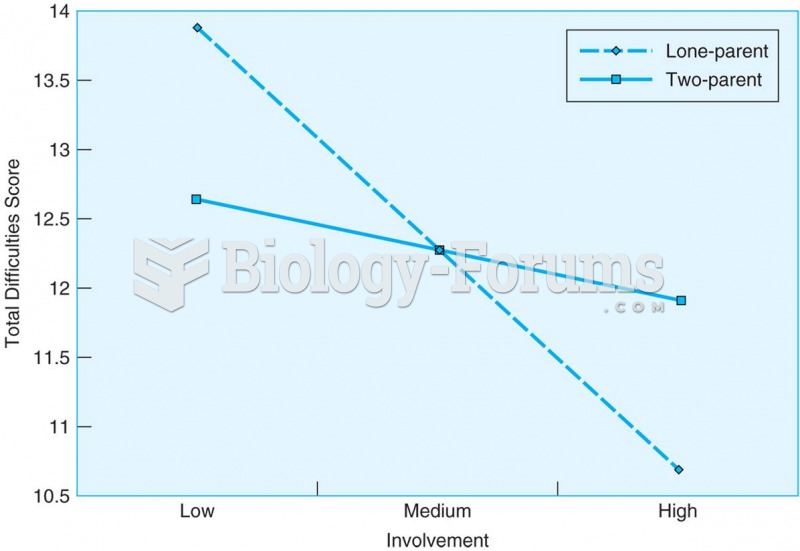 When teenagers live in single-parent homes, a good relationship with grandparents is related to ...
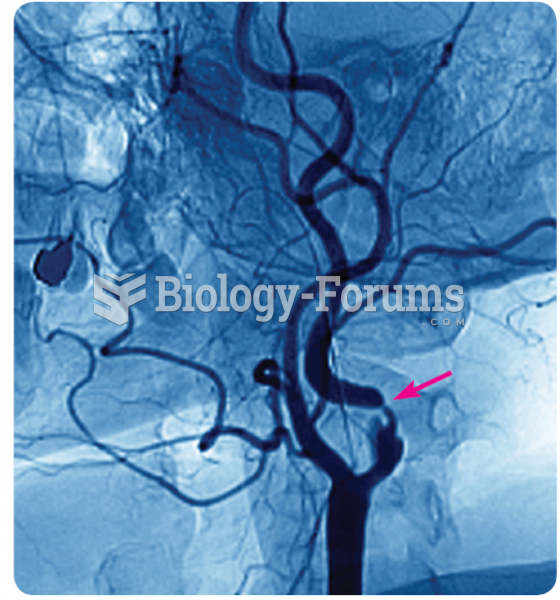 An angiogram that illustrates narrowing of the carotid artery (see arrow), the main pathway of blood ...
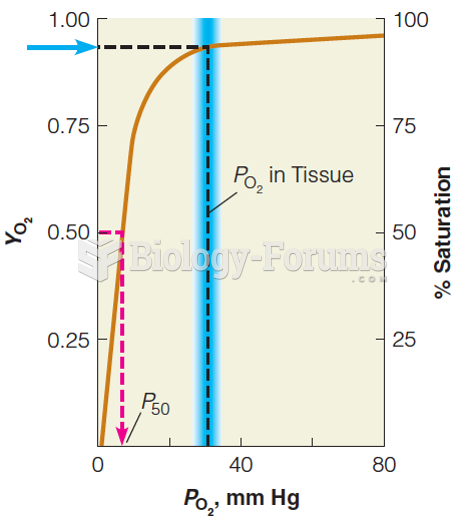 Oxygen-binding curve for myoglobin
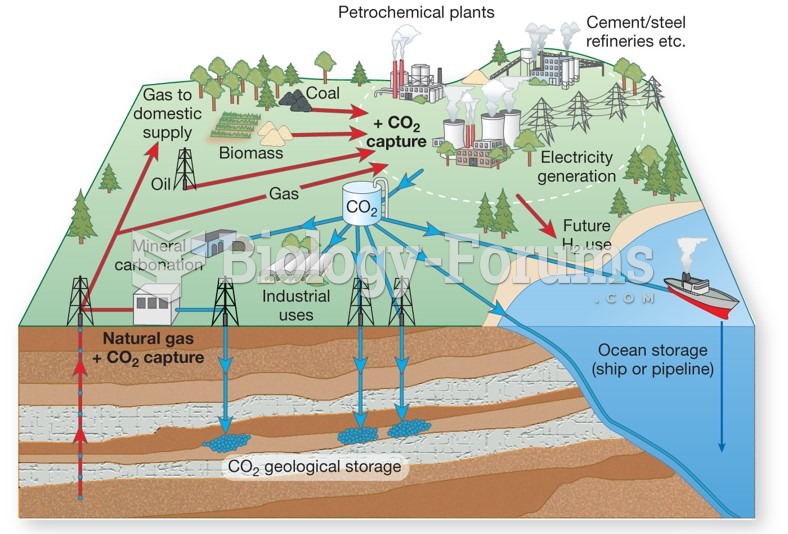 The growing demand for electrical power, carbon sequestration and storage must be a priority
 The slope of the curve y = ax^3 - bx^2 + cx - 3 at x = 2 is 5. If the point of inflection of the cur
 Find the factor demand for labour and the amount of output it will produce. Show all ...