|
|
|

Did you know?
Methicillin-resistant Staphylococcus aureus or MRSA was discovered in 1961 in the United Kingdom. It if often referred to as a superbug. MRSA infections cause more deaths in the United States every year than AIDS.

 Methods to Document Peripheral Pulses A. Stick Figure Peripheral Pulse Documentation B. Tabular Peri
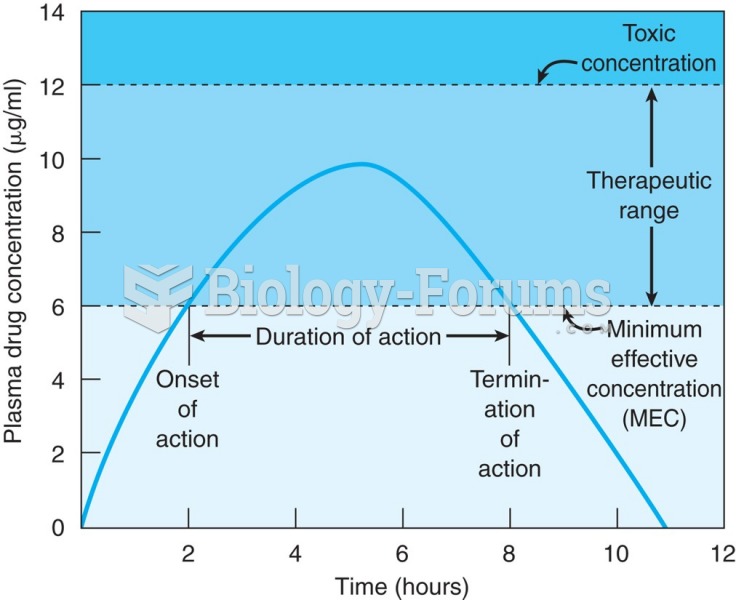 Graph showing oral administration of a single-dose drug. The time of onset is 2 hours and the end of ...
 Circling the forearm to create movement at the elbow.
 How to create a frequency table and histogram from raw data
 Graph Liters per Hour
 Connecting blunt ends to create recombinant DNA molecules