In the above figure, the axis breaks are used
A) to create a misleading graph.
B) to indicate that there are jumps from the origin, 0, to the first values recorded along the axes.
C) to indicate that there are not enough data to be included in the graph.
D) to show that there are no data available for the omitted ranges.
Question 2
In the above figure, if aggregate demand does not change, the short-run equilibrium will
A) eventually adjust to a long-run equilibrium with a higher price level.
B) not adjust on its own.
C) eventually adjust to a long-run equilibrium with a lower price level.
D) None of the above answers are correct.

 Japanese farmers create pentagon-shaped oranges
 James Madison was a key figure at the Constitutional Convention of 1787 in Philadelphia. He not only
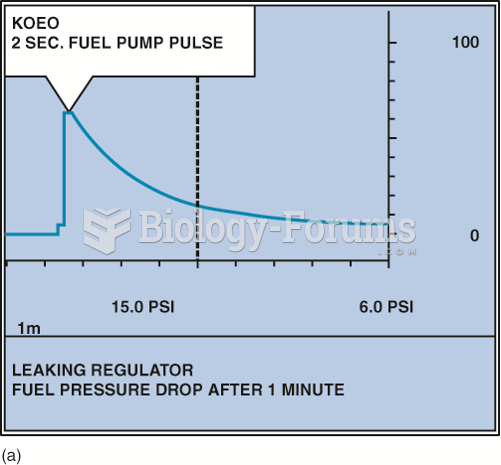 A fuel-pressure graph after key on, engine off (KOEO) on a TBI system.
 Mobilize joints of the feet and ankle. Apply scissoring to metatarsals and figure-8s to toes. Dorsi- ...
 Re-creation of Pheidias’s Huge Gold and Ivory Figure of Athena
 Figure and Ground