In the above figure, the axis breaks are used
A) to create a misleading graph.
B) to indicate that there are jumps from the origin, 0, to the first values recorded along the axes.
C) to indicate that there are not enough data to be included in the graph.
D) to show that there are no data available for the omitted ranges.
Question 2
In the above figure, if aggregate demand does not change, the short-run equilibrium will
A) eventually adjust to a long-run equilibrium with a higher price level.
B) not adjust on its own.
C) eventually adjust to a long-run equilibrium with a lower price level.
D) None of the above answers are correct.

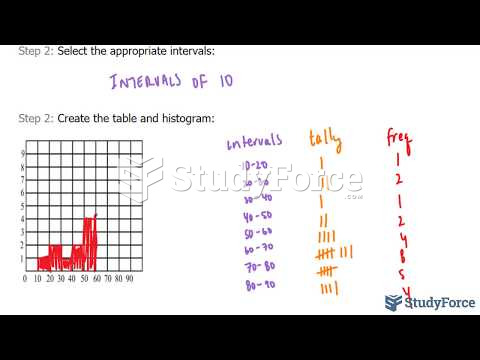 How to create a frequency table and histogram from raw data
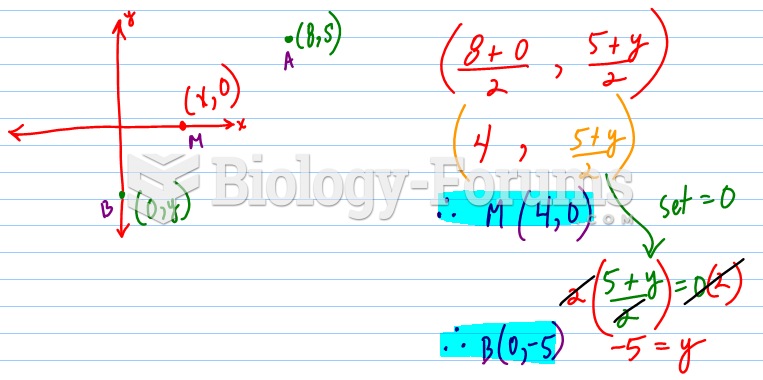 M is the midpoint of a line segment with endpoints A & B. If B is locates on the y-axis, and M ...
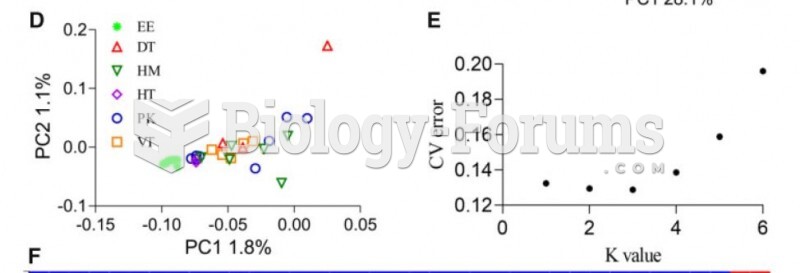 graph
graph
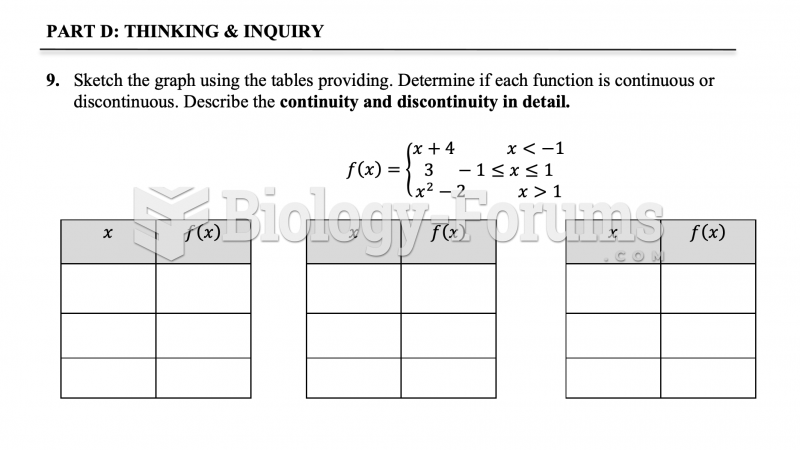 calculus homework graph help please
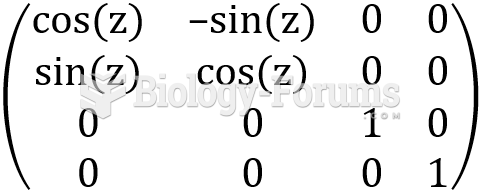 To rotate a matrix along the z-axis
 Reengineering the Ti plasmid to create transgenic plants